Home
2023

Achieve your target
Want to understand the targets package? It won’t get any easier than this.. Continue reading Achieve your target

Pivoting data in R with tidyr and data.table
How to pivot data in R with data.table and tidyr. Examples of melt, dcast, pivot_longer and pivot_wider Continue reading Pivoting data in R with tidyr and data.table
Fixing my broken VSCode setup for R
Here’s how I set up the correct user settings and keybindings for using R in VSCode Continue reading Fixing my broken VSCode setup for R
Making headlines
Using the headliner package for data driven ggplot titles Continue reading Making headlines
2022
On target
A beginners introduction to getting started with the targets package in R Continue reading On target

Cover Up
Adding full sized cover images to Word documents programatically with officer, officedown, and purrr Continue reading Cover Up

Word Up - automatic reporting with MS Word, Officedown and flextable
Recreating existing Word reports in RMarkdown with Officer, Officedown and flextable. Continue reading Word Up - automatic reporting with MS Word, Officedown and flextable

modifying columns in datatable with lapply
How to modify or update multiple columns in rdatatable with lapply and SDcols Continue reading modifying columns in datatable with lapply

Exploring your database with shiny
Programatically querying a database with flexible SQL queries and visualising the results with shiny. Continue reading Exploring your database with shiny

Iterating over multiple database tables with the tidyverse
Extracting data from multiple database tables with dplyr and purrr. Continue reading Iterating over multiple database tables with the tidyverse

Dynamic SQL queries with R
Programmatic querying with dynamic schema, table and column names. Continue reading Dynamic SQL queries with R
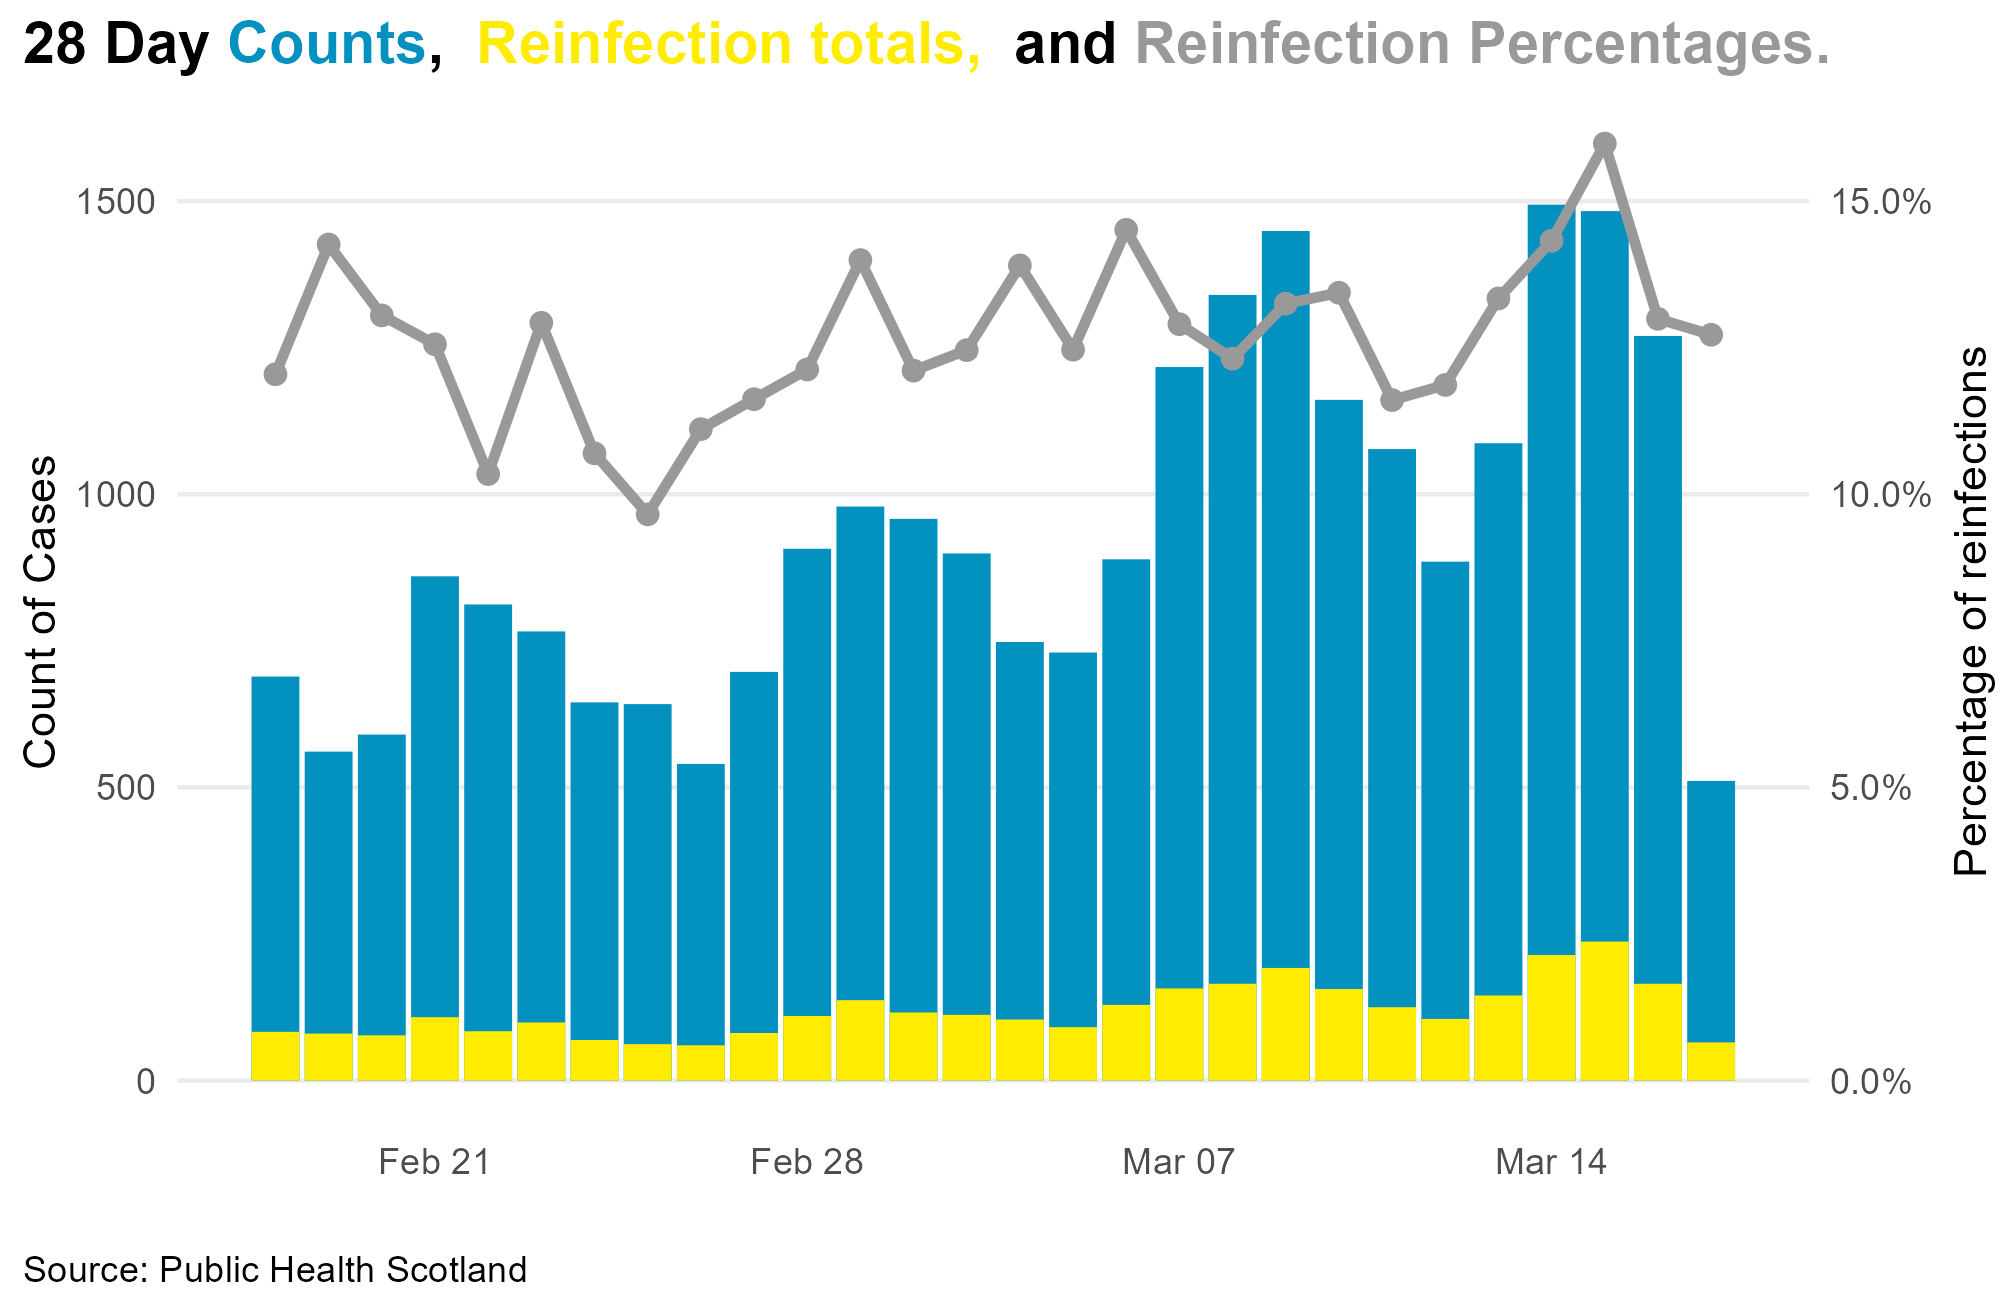
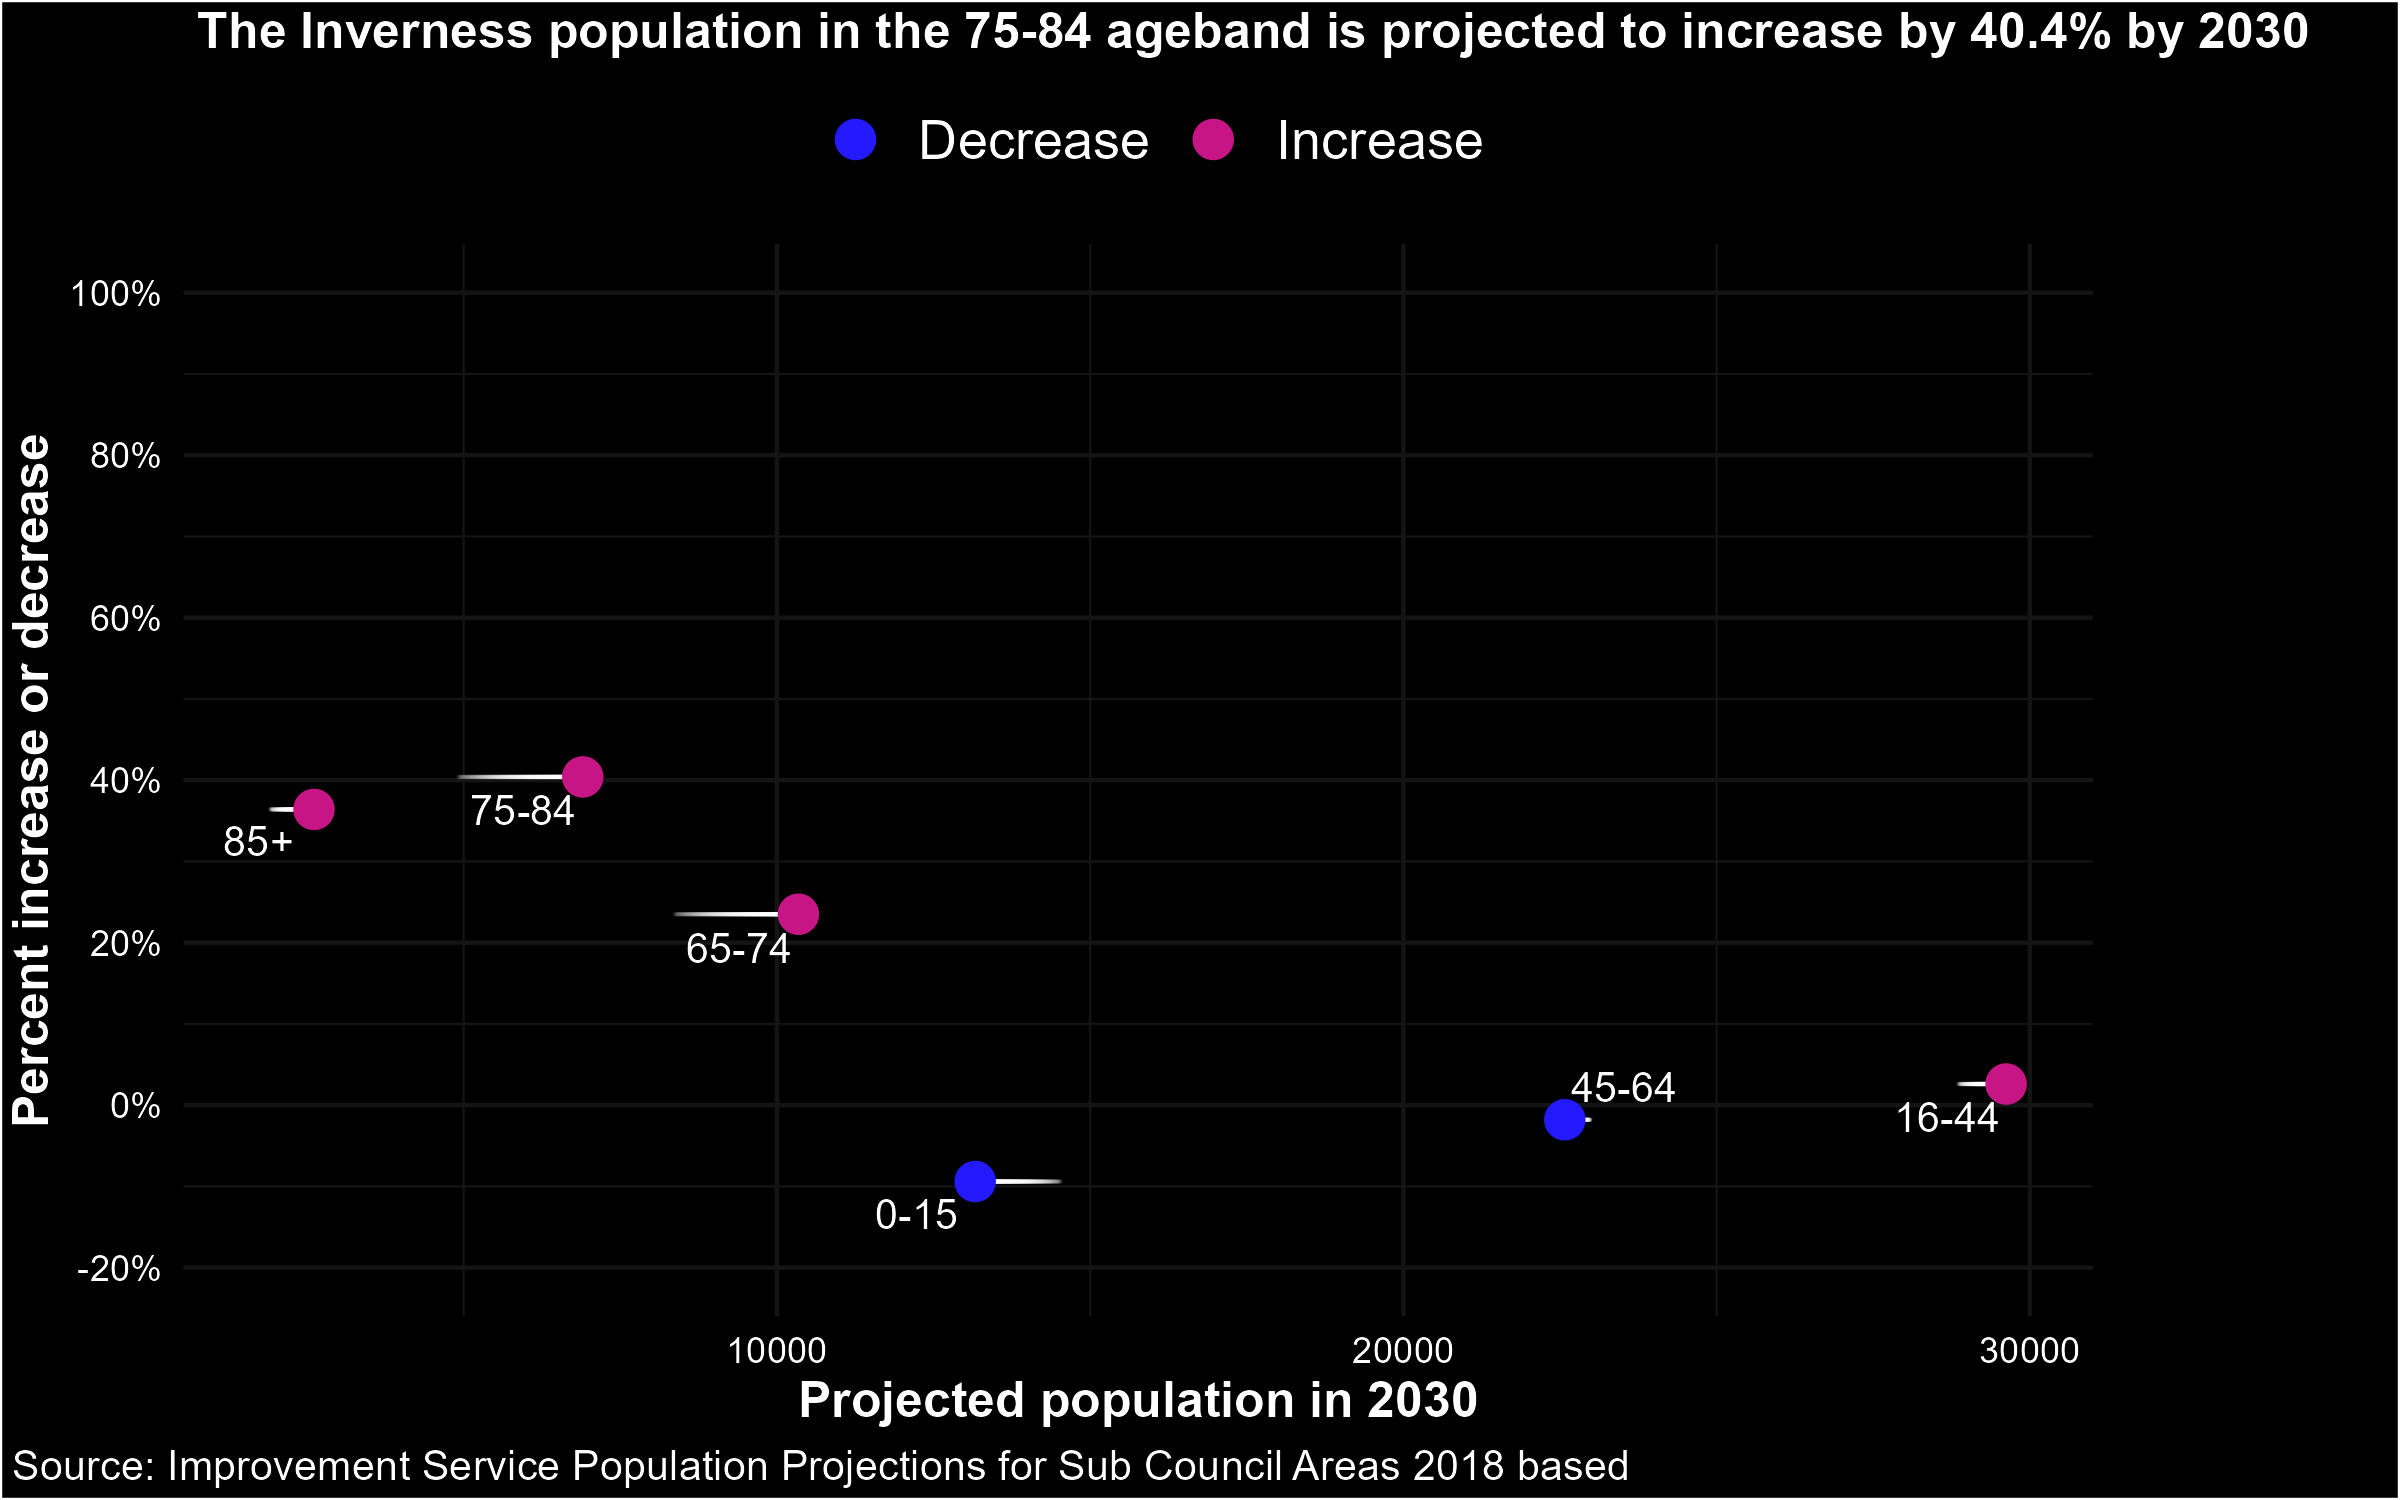
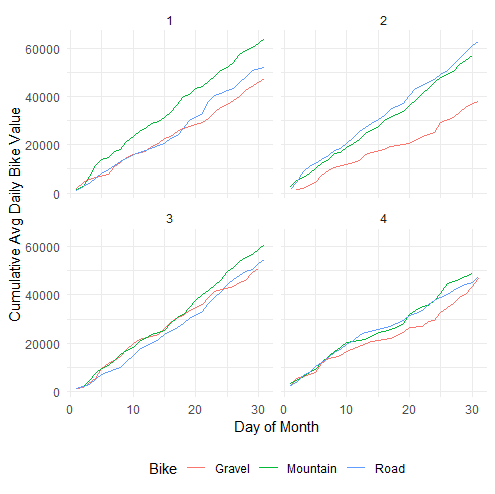
Dual axis charts in ggplot2 - why they can be useful and how to make them
Create Pareto charts in ggplot2 with custom legends using manual scales and ggtext Continue reading Dual axis charts in ggplot2 - why they can be useful and how to make them

Getting to know Julia
Trying out some basic data operations (download, minimal wrangling and plotting) in Julia Continue reading Getting to know Julia

Separate SQL
Why you should consider keeping your SQL queries in a separate file. Continue reading Separate SQL
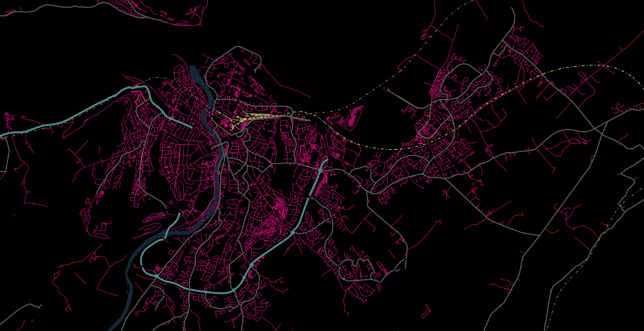
Inverness street maps
Ticking off the rstats bucket list - emulating Taras Kaduk’s street map - but in a Highland stylee with OSM, sf and ggdark Continue reading Inverness street maps

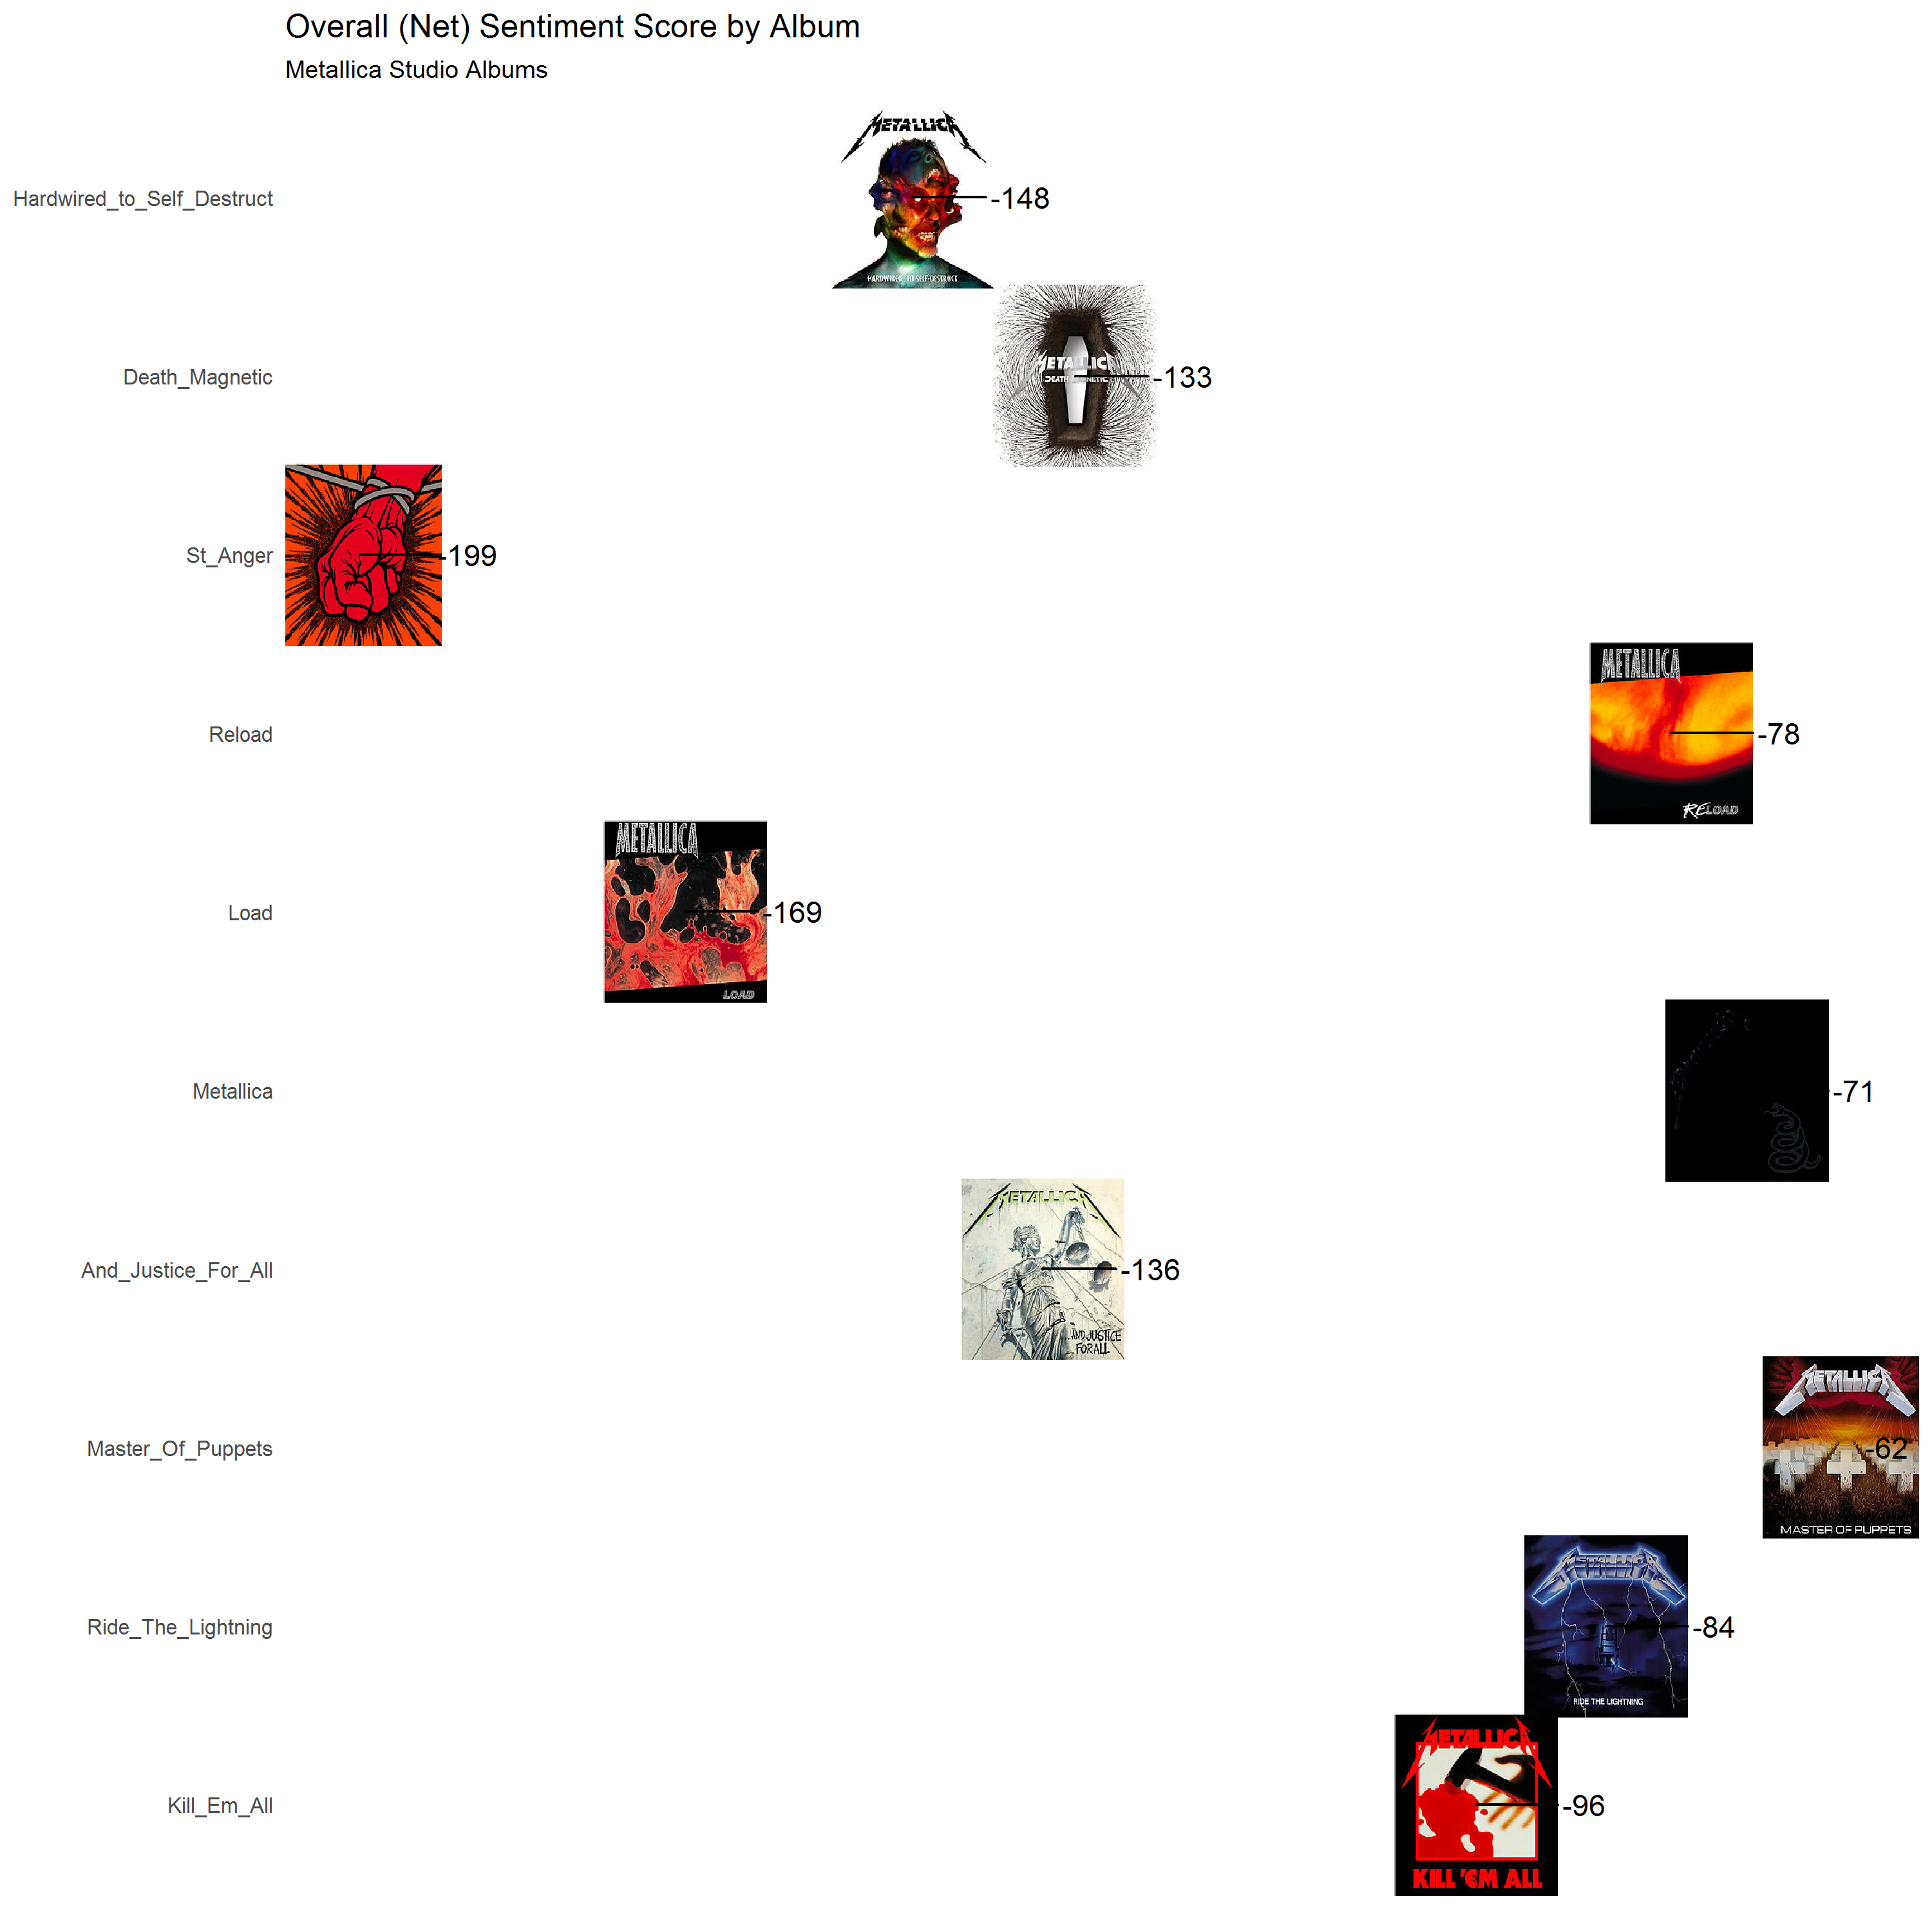
Song lyric sentiment analysis doesn't work
Comparing negative lyric sentiments from Metallica - Master of Puppets to the reactions the music generates. Continue reading Song lyric sentiment analysis doesn't work
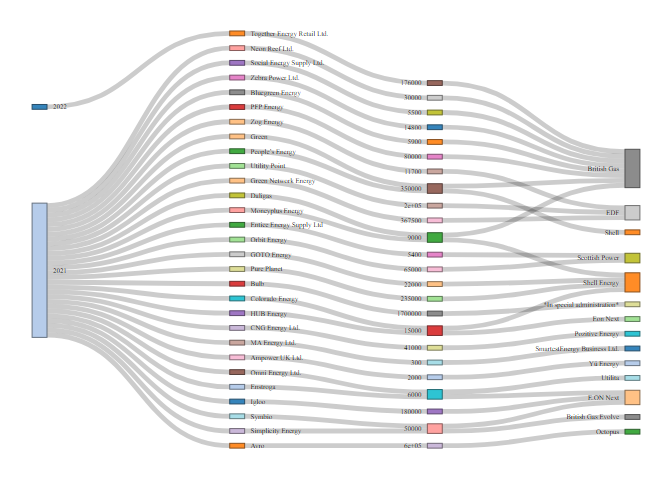
Visualising collapsed UK energy company acquisitions
Sankey plots are ideal to show the flow of customers from collapsing energy companies. Here’s how to prepare and plot your data with dplyr and networkD3 Continue reading Visualising collapsed UK energy company acquisitions
Reactable Rocks!
Make engaging tables in R with {reactable} and {reactablefmtr} Continue reading Reactable Rocks!

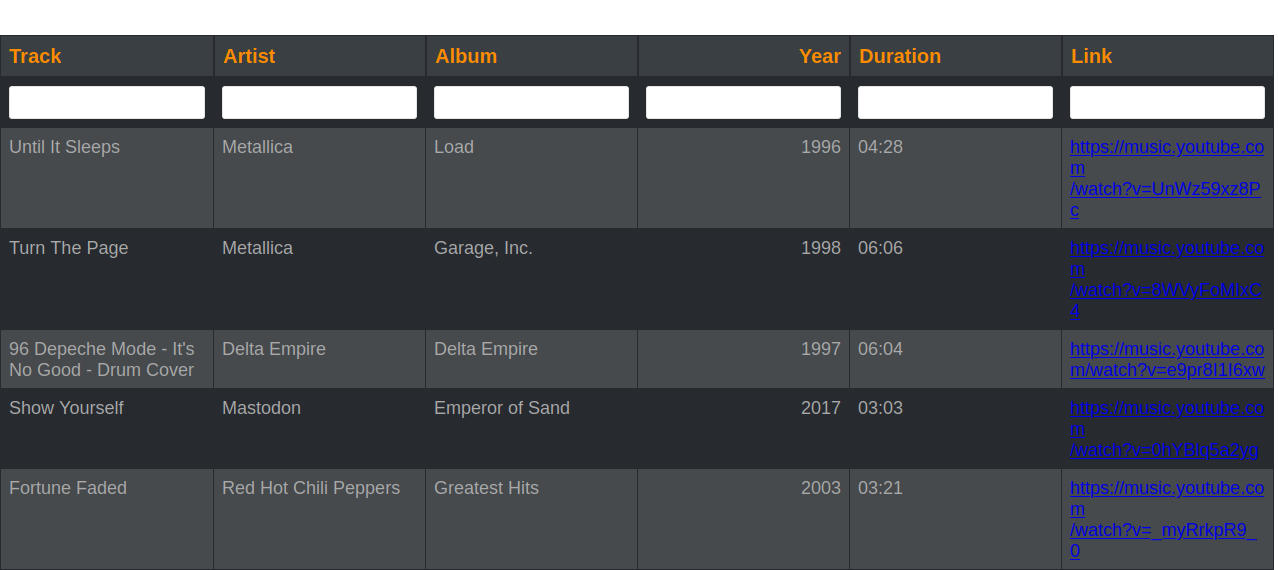
Wordclouds? - Get outta here. Bobclouds? Now you're talking
A pleasant diversion into the world of Bob Mortimer with {tuber} and {tidytext} Continue reading Wordclouds? - Get outta here. Bobclouds? Now you're talking
2021
I got my first package onto CRAN, and YOU CAN TOO
Here are some tips and links to help you get your package onto CRAN Feel the fear, do the checks, go for it. . if I can do it, so can you Continue reading I got my first package onto CRAN, and YOU CAN TOO

Shooting Stars
Why you should consider starring repos on GitHub. Continue reading Shooting Stars
cusumcharter available on CRAN
Introducing the cusumcharter package which makes it easier to create and plot CUSUM control charts. Continue reading cusumcharter available on CRAN
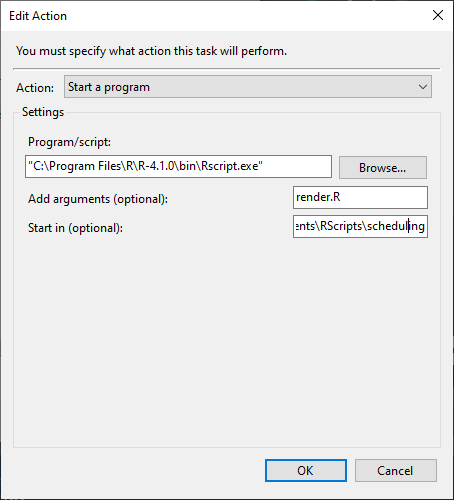
Scheduling Rmarkdown files on Windows - your foolproof guide
Scheduling an Rmarkdown or quarto script can be tricky - there are a few issues that are not always obvious. Here’s how to run yours successfully. Continue reading Scheduling Rmarkdown files on Windows - your foolproof guide
Passing parameters to SQL Server functions using R
Using interpolation to parameterise an input into the SQL Server DATEADD function, via R. Useful when you want to pass a variable somewhere deep inside your SQL query Continue reading Passing parameters to SQL Server functions using R
fwf without the faff
Fixed width files aren’t too common, but they don’t have to be scary. readr comes to the rescue with read_fwf() Continue reading fwf without the faff
Calculating hotel occupancy with R
Putting patientcounter to the test by calculating hotel occupancy. Continue reading Calculating hotel occupancy with R
Well Well Well my Excel
Ways to combine multiple excel workbooks into one dataframe, using purrr, data.table, rio and base R. Continue reading Well Well Well my Excel

Cutting down code in dplyr and data.table
Optimising code in data.table and tidyverse. Continue reading Cutting down code in dplyr and data.table

Introducing popthemes
Introducing another set of palettes and scales for ggplot2, based on pop album covers. Continue reading Introducing popthemes
Some data.table tips
Rolling joins, wrapping functions around regular DT[] calls, and more. Continue reading Some data.table tips
Scheduled Refresh - a surprisingly simple fix
Scheduled Refresh wasn’t working on our server, despite the correct credentials being supplied with the correct account and privileges Continue reading Scheduled Refresh - a surprisingly simple fix
PreppinData - accepting the challenge with R and PowerBI
I’ve completed a month of ‘PreppinData’ challenges, using both R and PowerBI. Some things have been easy, some have not - here’s what I’ve learned in Week 1 Continue reading PreppinData - accepting the challenge with R and PowerBI
2020

demystifying the coalesce function
coalesce is one of the most useful functions that you’re probably not using. Want to find the first non NA value from one or more vectors? You need coalesce Continue reading demystifying the coalesce function
collapse might rock your world
collapse is a new force in the data transformation stakes. In this post, I try out one simple function and compare it to data.table and dplyr Continue reading collapse might rock your world

NHS-R Community Conference 2020
The 3rd Annual NHS-R Community Conference went virtual, and was an amazing success Continue reading NHS-R Community Conference 2020
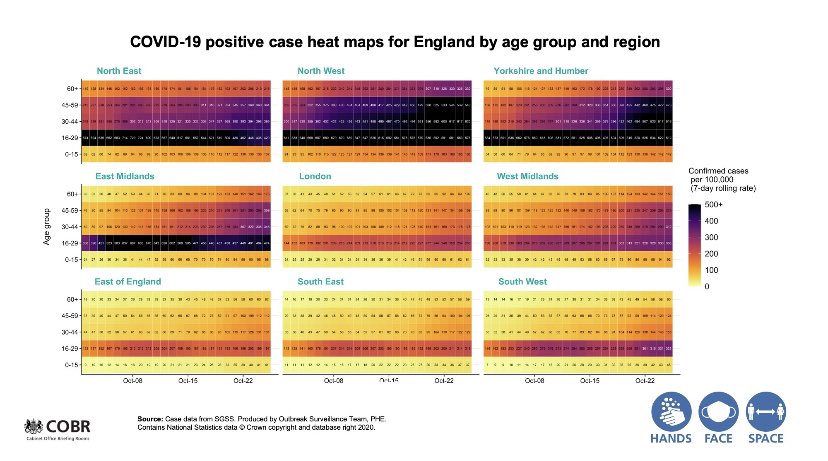
When dataviz meets 'reality'
The UK Government Coronavirus briefing on Saturday caused all sorts of consternation. Not least, the graphics that were presented in support of further lockdown. What happened, how bad was it really, and what could be improved? Continue reading When dataviz meets 'reality'
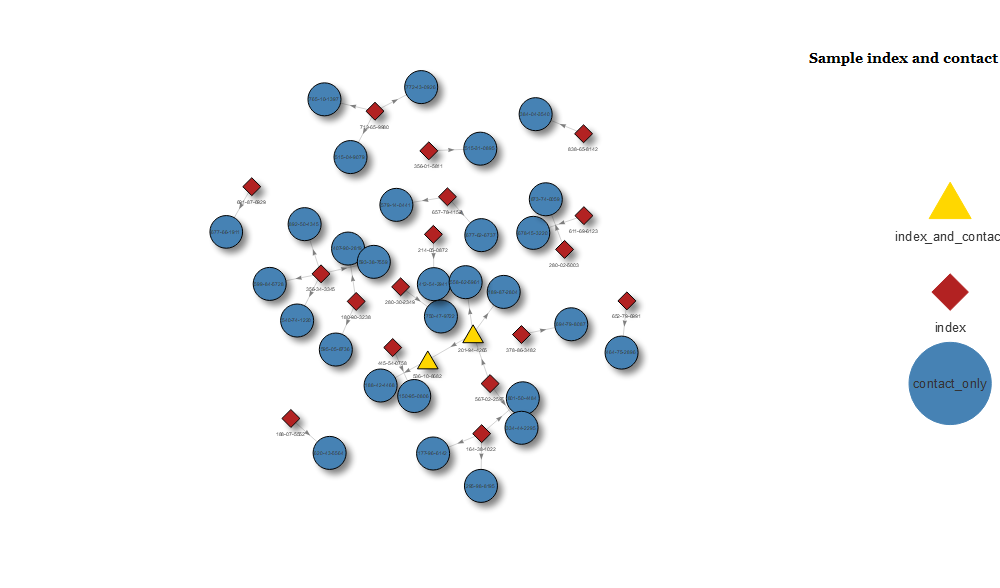
Getting started with network plots
The visNetwork package greatly simplifies the process of producing useful, interactive network plots. Continue reading Getting started with network plots
The day after
Spreadsheets find themselves in the news for all the wrong reasons. Is R’s time in healthcare now? Continue reading The day after

metallicaRt
Seek and Destroy meets School of Rock as a new Metallica inspired colour pallete package for R Continue reading metallicaRt
QI at R/Medicine 2020
Rapid Analysis and Presentation of Quality Improvement Data with R Continue reading QI at R/Medicine 2020

Solving small data problems with data.table
Combining elements from different rows while discarding NA values Continue reading Solving small data problems with data.table
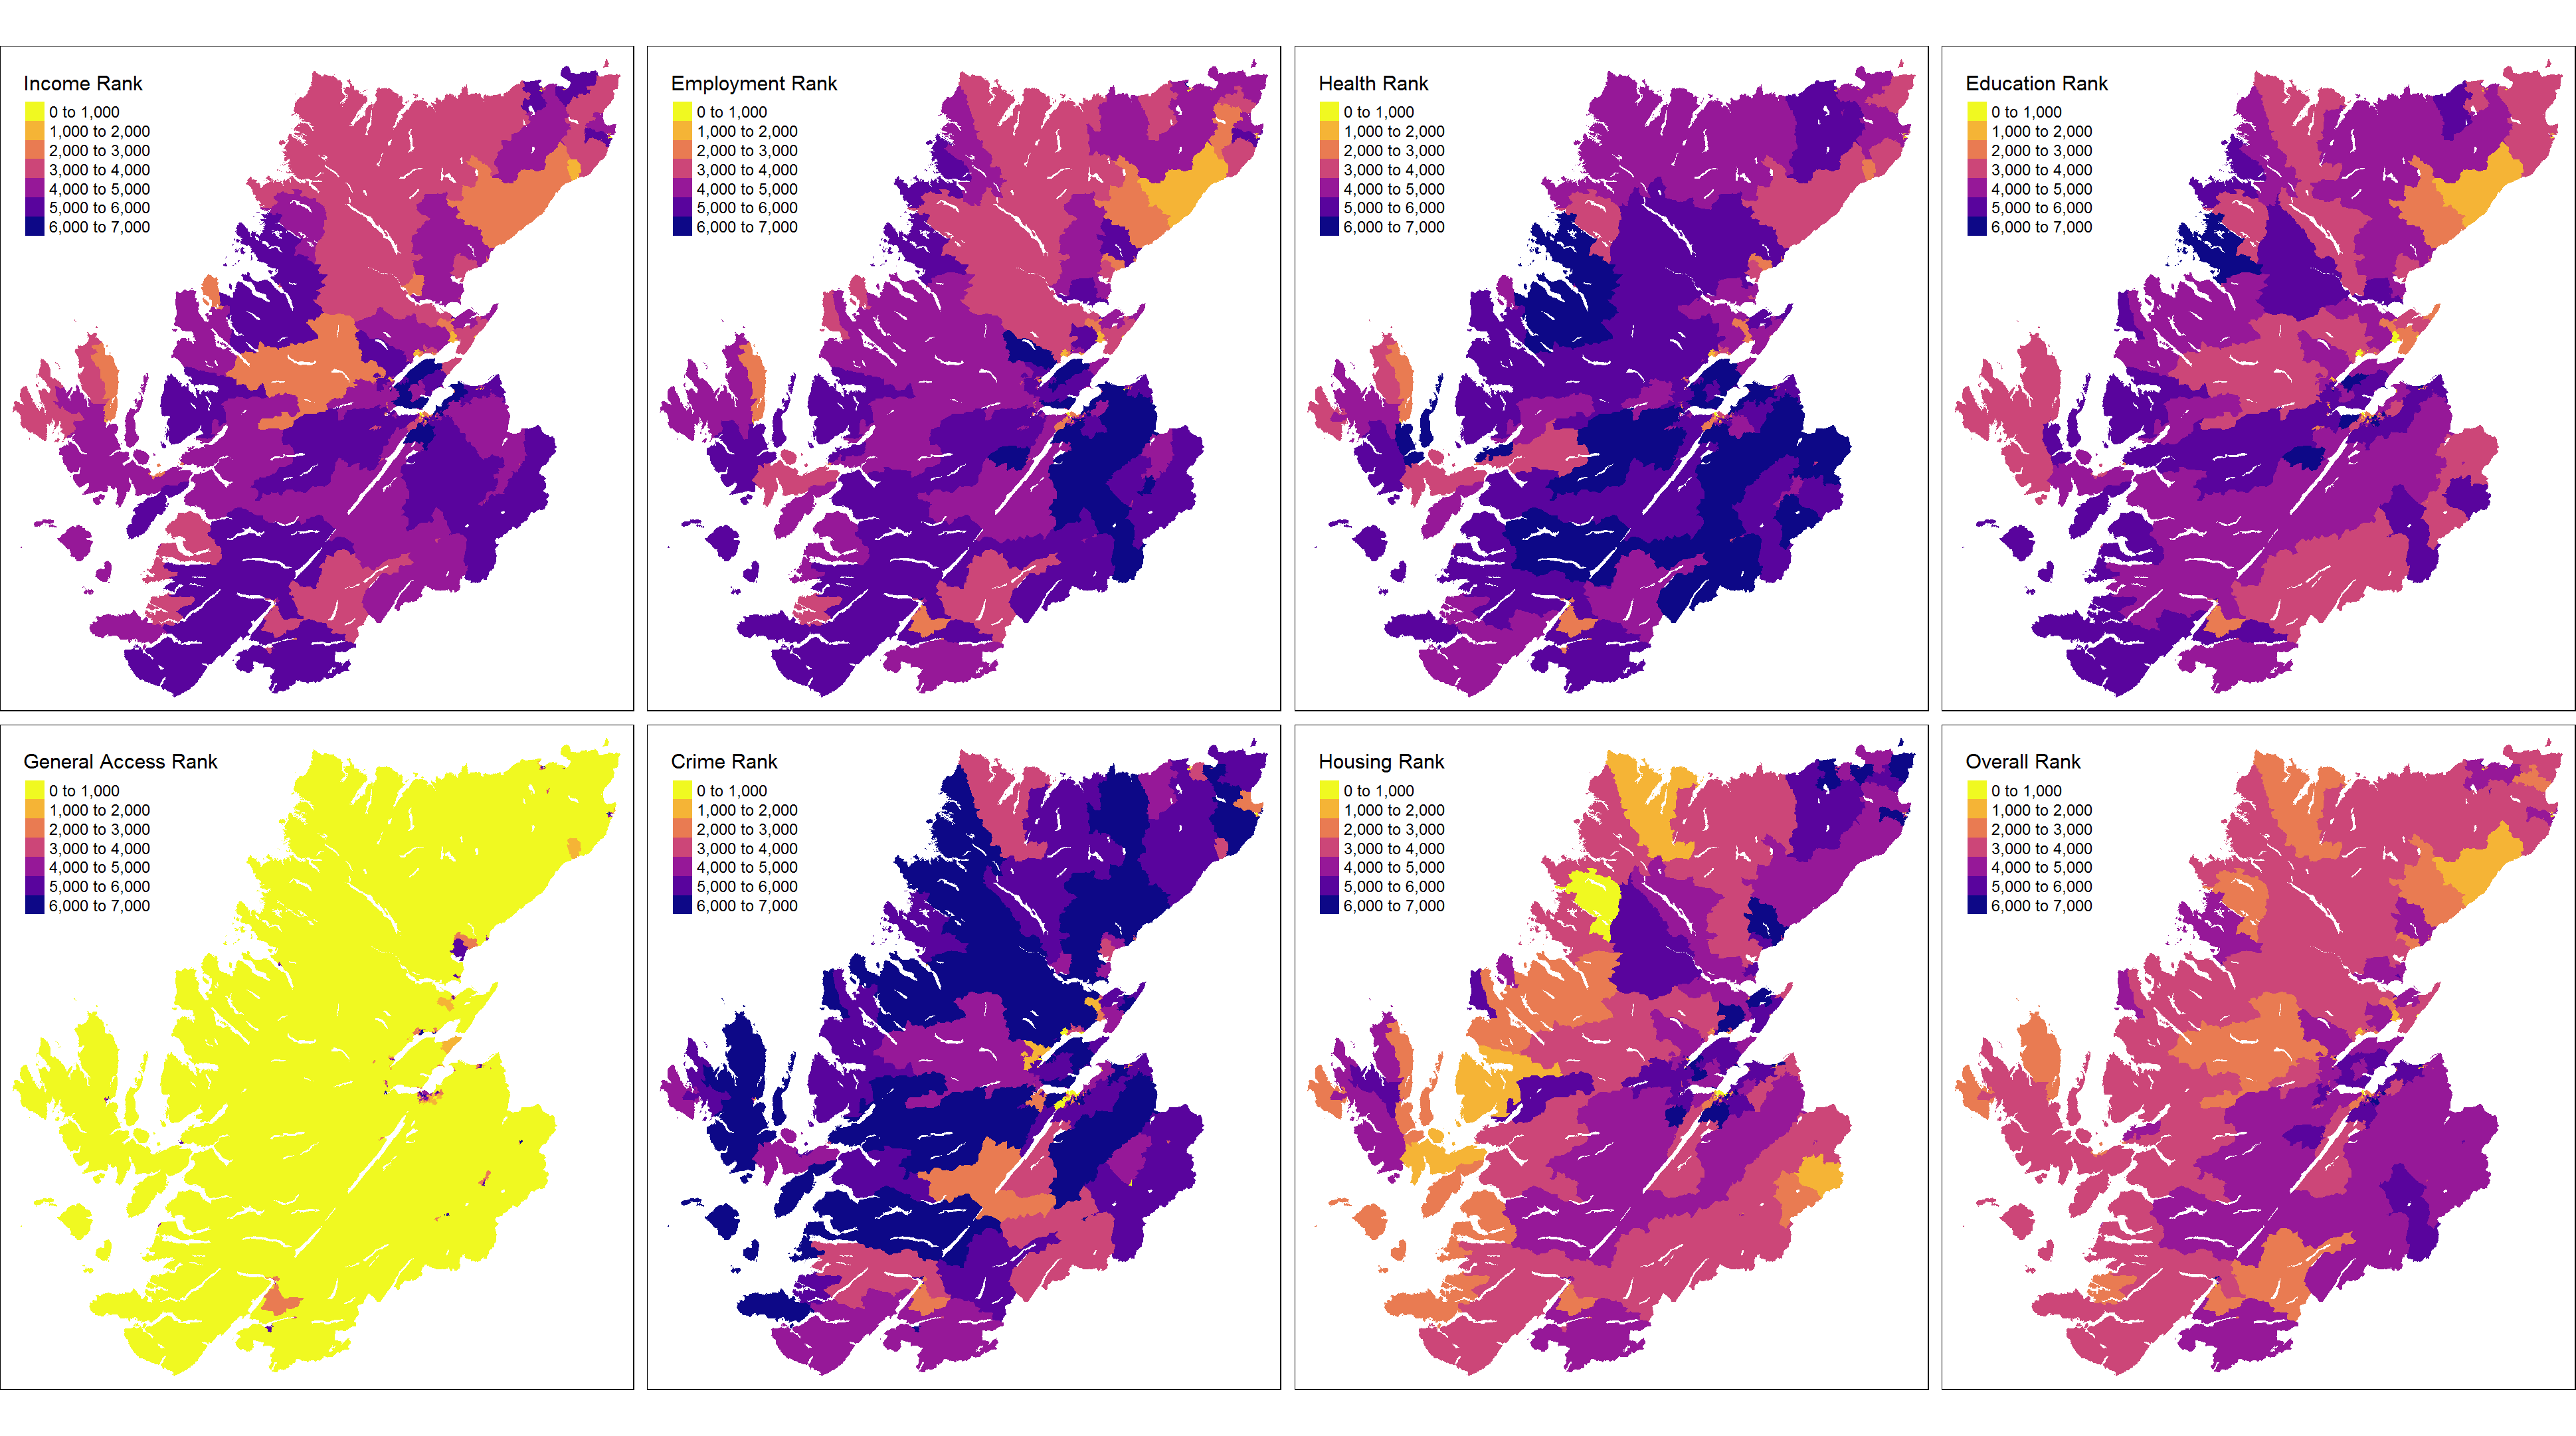
SIMD Revisited
Visualising the 2020 Scottish Index of Multiple Deprivation data. Continue reading SIMD Revisited
patientcounter
Introducing the patientcounter package to create census tables without crashing Excel, and no need for SQL Continue reading patientcounter

Programming with data.table
getting started with multiple bare variable names in data.table functions. Continue reading Programming with data.table
2019
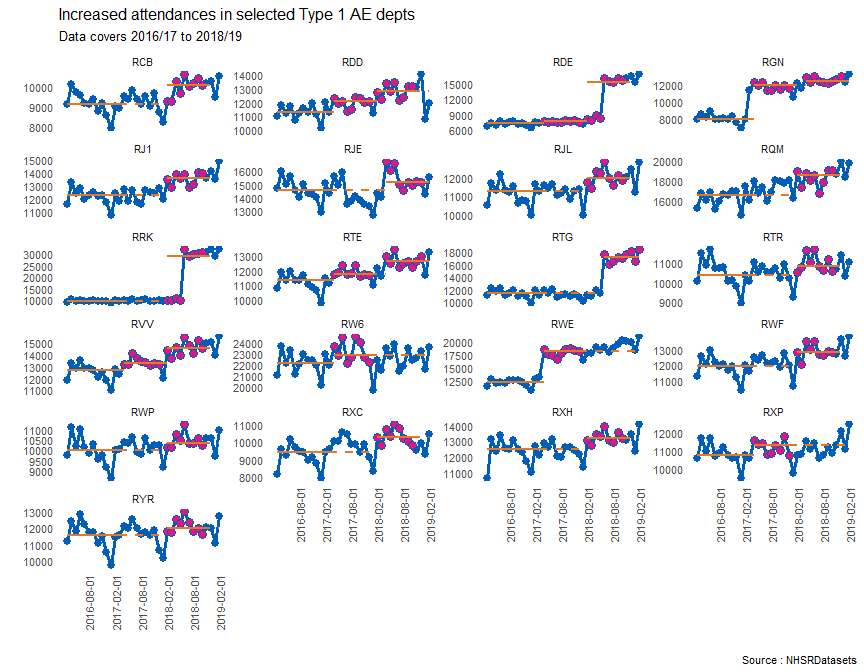
NHSRdatasets meets runcharter
New packages by NHS analysts, for NHS analysts Continue reading NHSRdatasets meets runcharter
data.table by a dummy - a dummies guide
A starter guide to the fabulous data.table package. An introduction to data.table for new users. Continue reading data.table by a dummy - a dummies guide
A wee look at group_map and group_split in dplyr
Continue reading A wee look at group_map and group_split in dplyr
gganimation for the nation
gganimate is now on CRAN so taking it for a test drive Continue reading gganimation for the nation
2018

Automatic (slides) for the people
Creating and saving multiple plots to Powerpoint Continue reading Automatic (slides) for the people
Where am I?
Notes on the here package Continue reading Where am I?
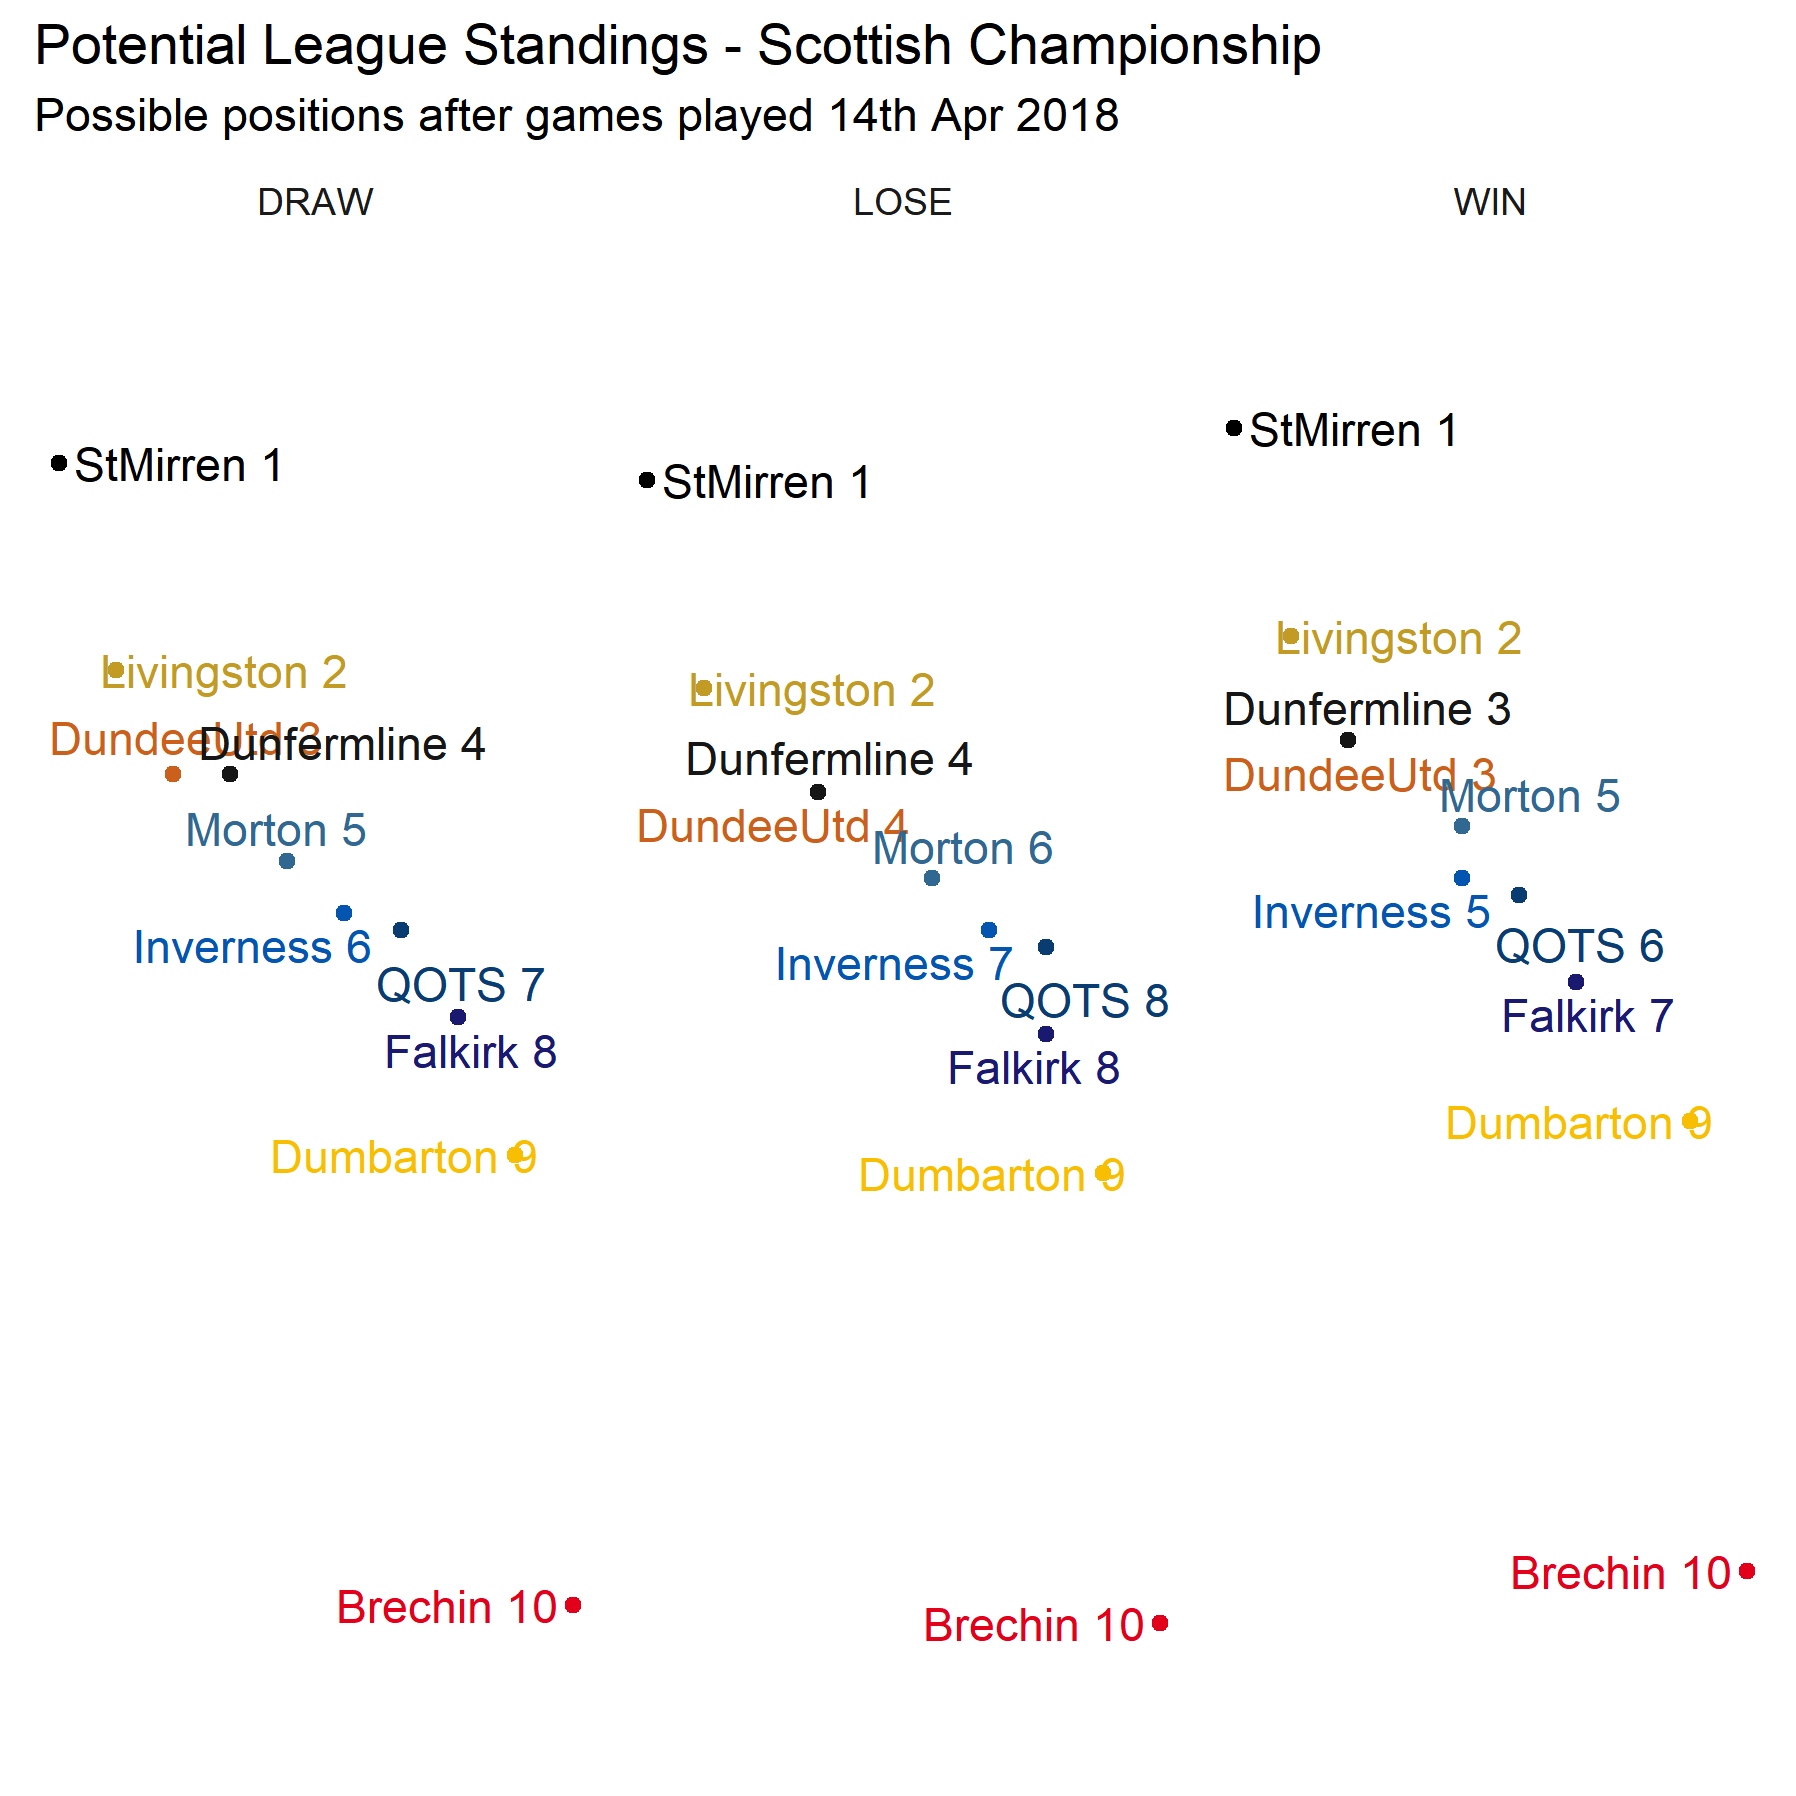
Mid Table Mediocrity
Visualising potential winners and promotion prospects in the Scottish Championship Continue reading Mid Table Mediocrity

More tidy evaluation with ggplot2
Another look at tidy evaluation with a slight twist on the previous post Continue reading More tidy evaluation with ggplot2
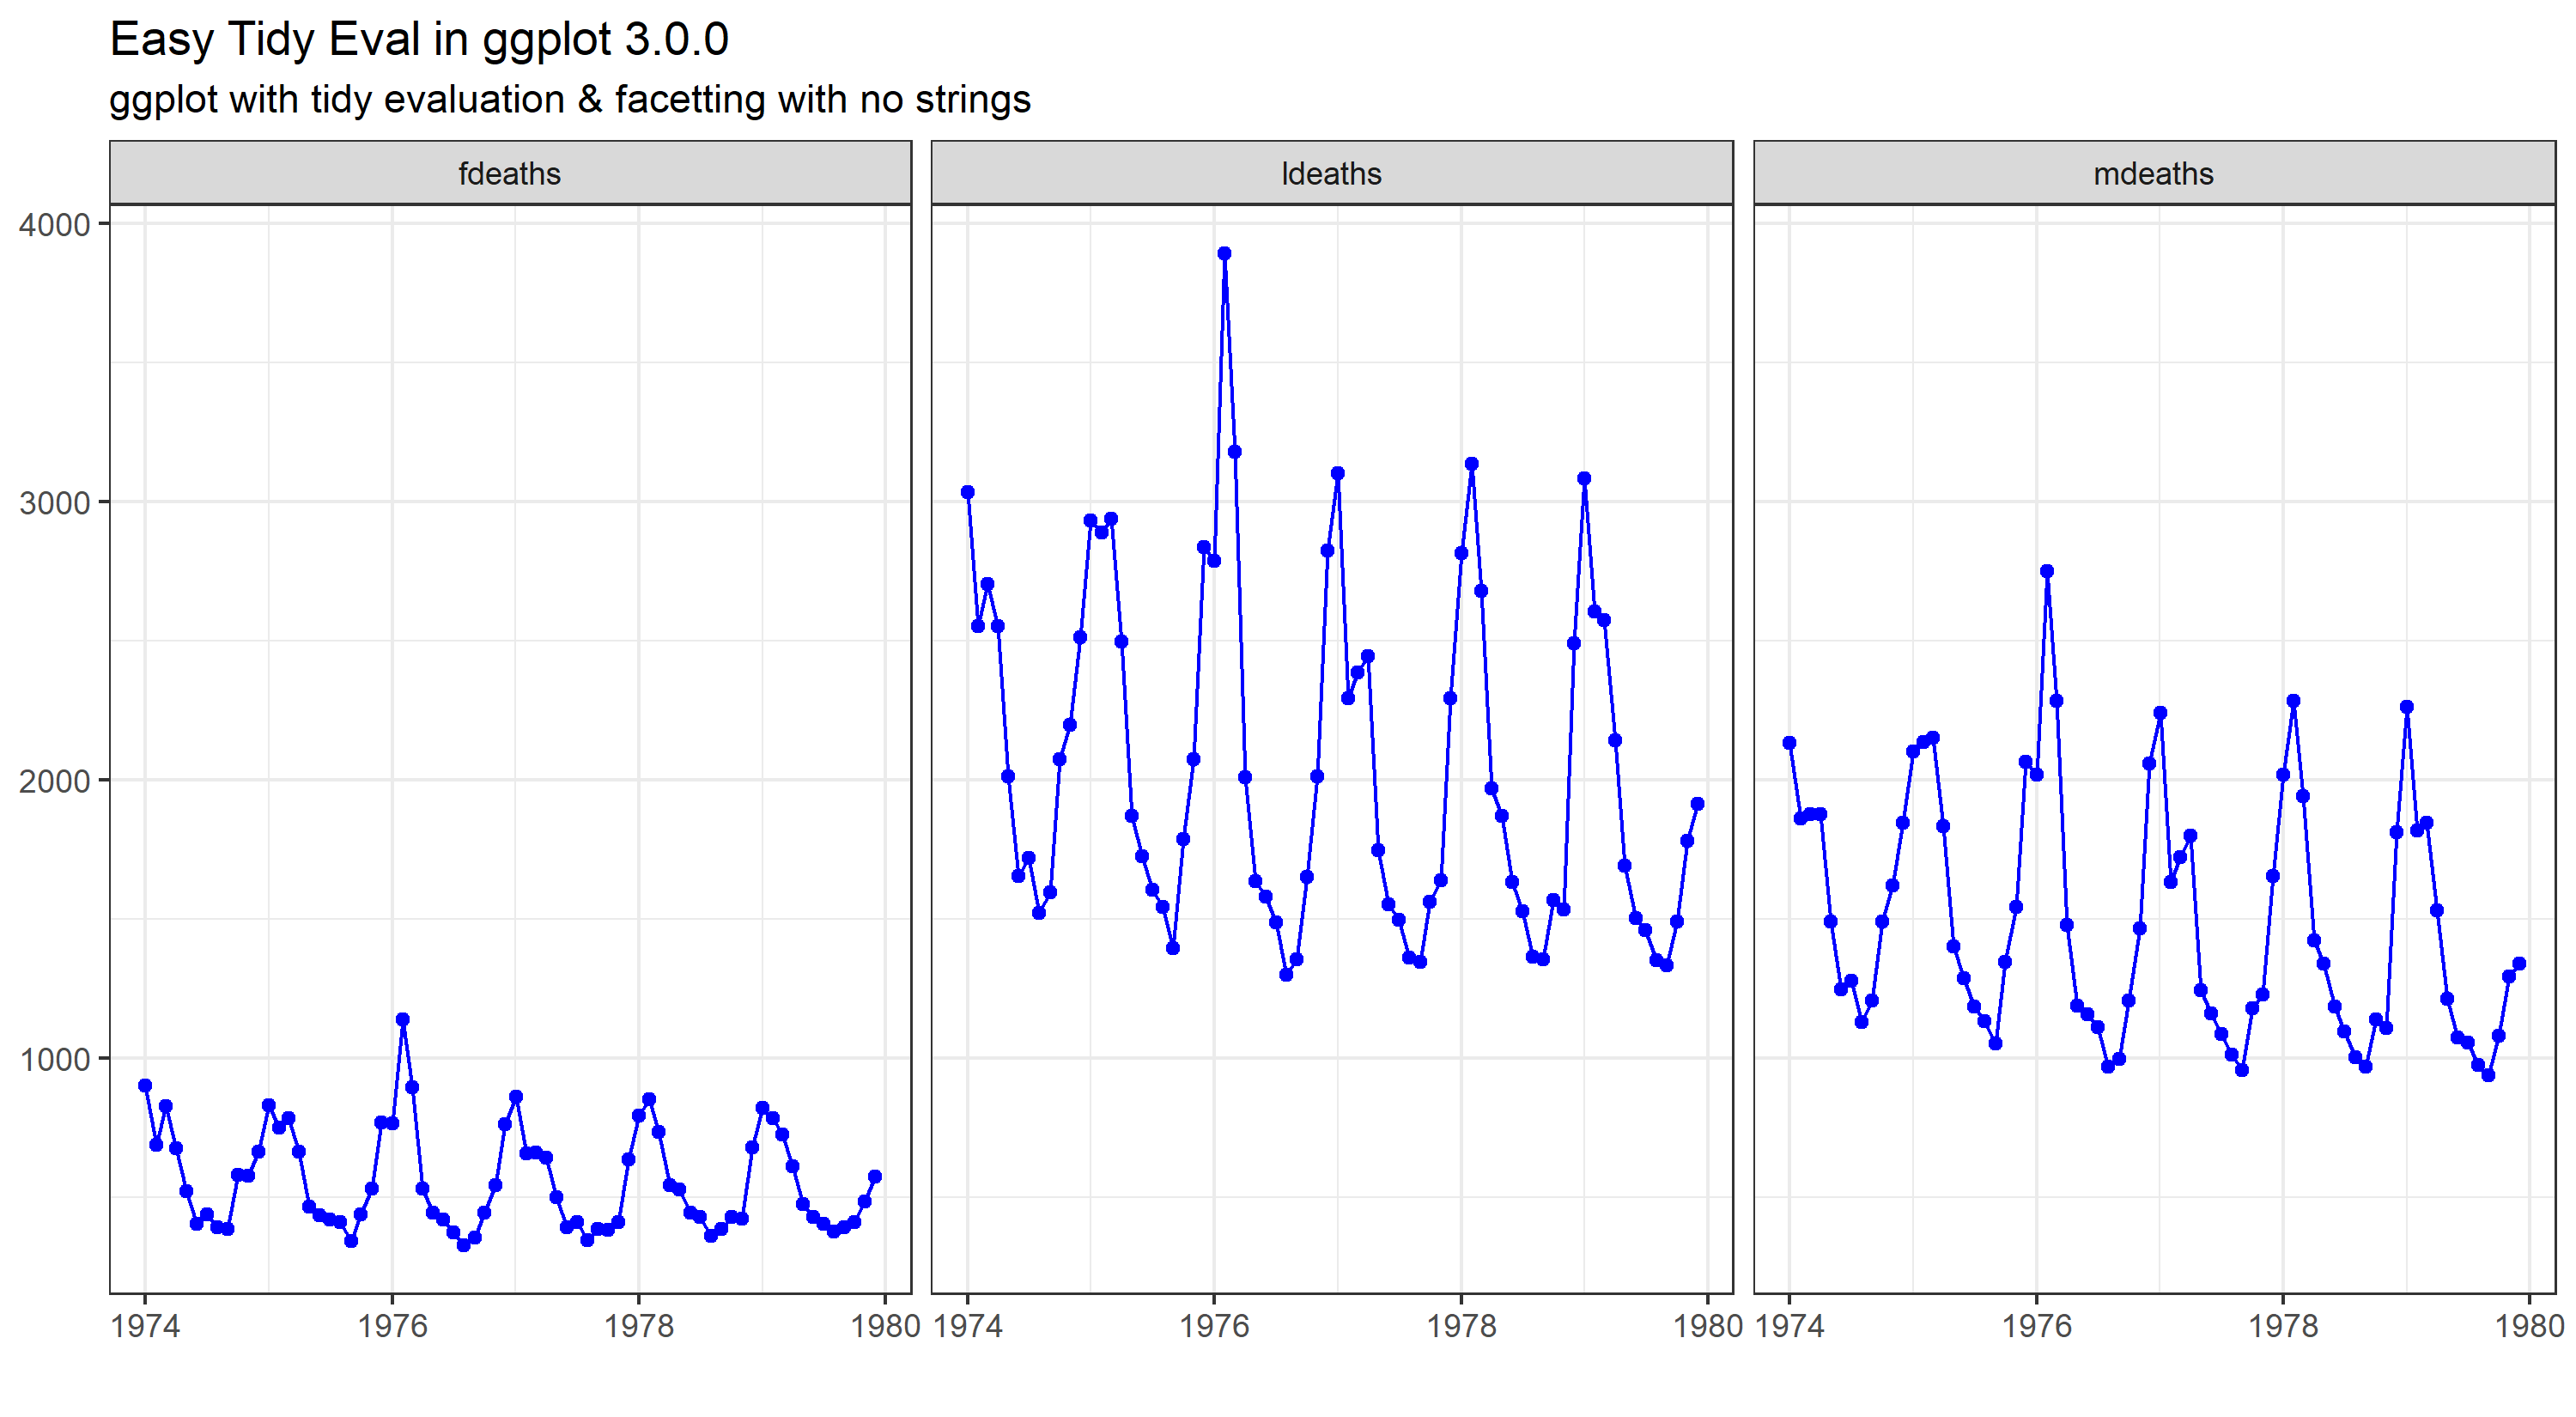
Tidily evaluated ggplot2
Test driving tidy evaluation in the new release of ggplot2 Continue reading Tidily evaluated ggplot2
Even Simpler SQL
A follow up post, with improved SQL and dplyr code Continue reading Even Simpler SQL
simpler SQL with dplyr
comparing dplyr with SQL nested queries - and there is only one winner Continue reading simpler SQL with dplyr

AphA Scotland - it's a thing now
Reflections on AphA Scotland launch event Continue reading AphA Scotland - it's a thing now
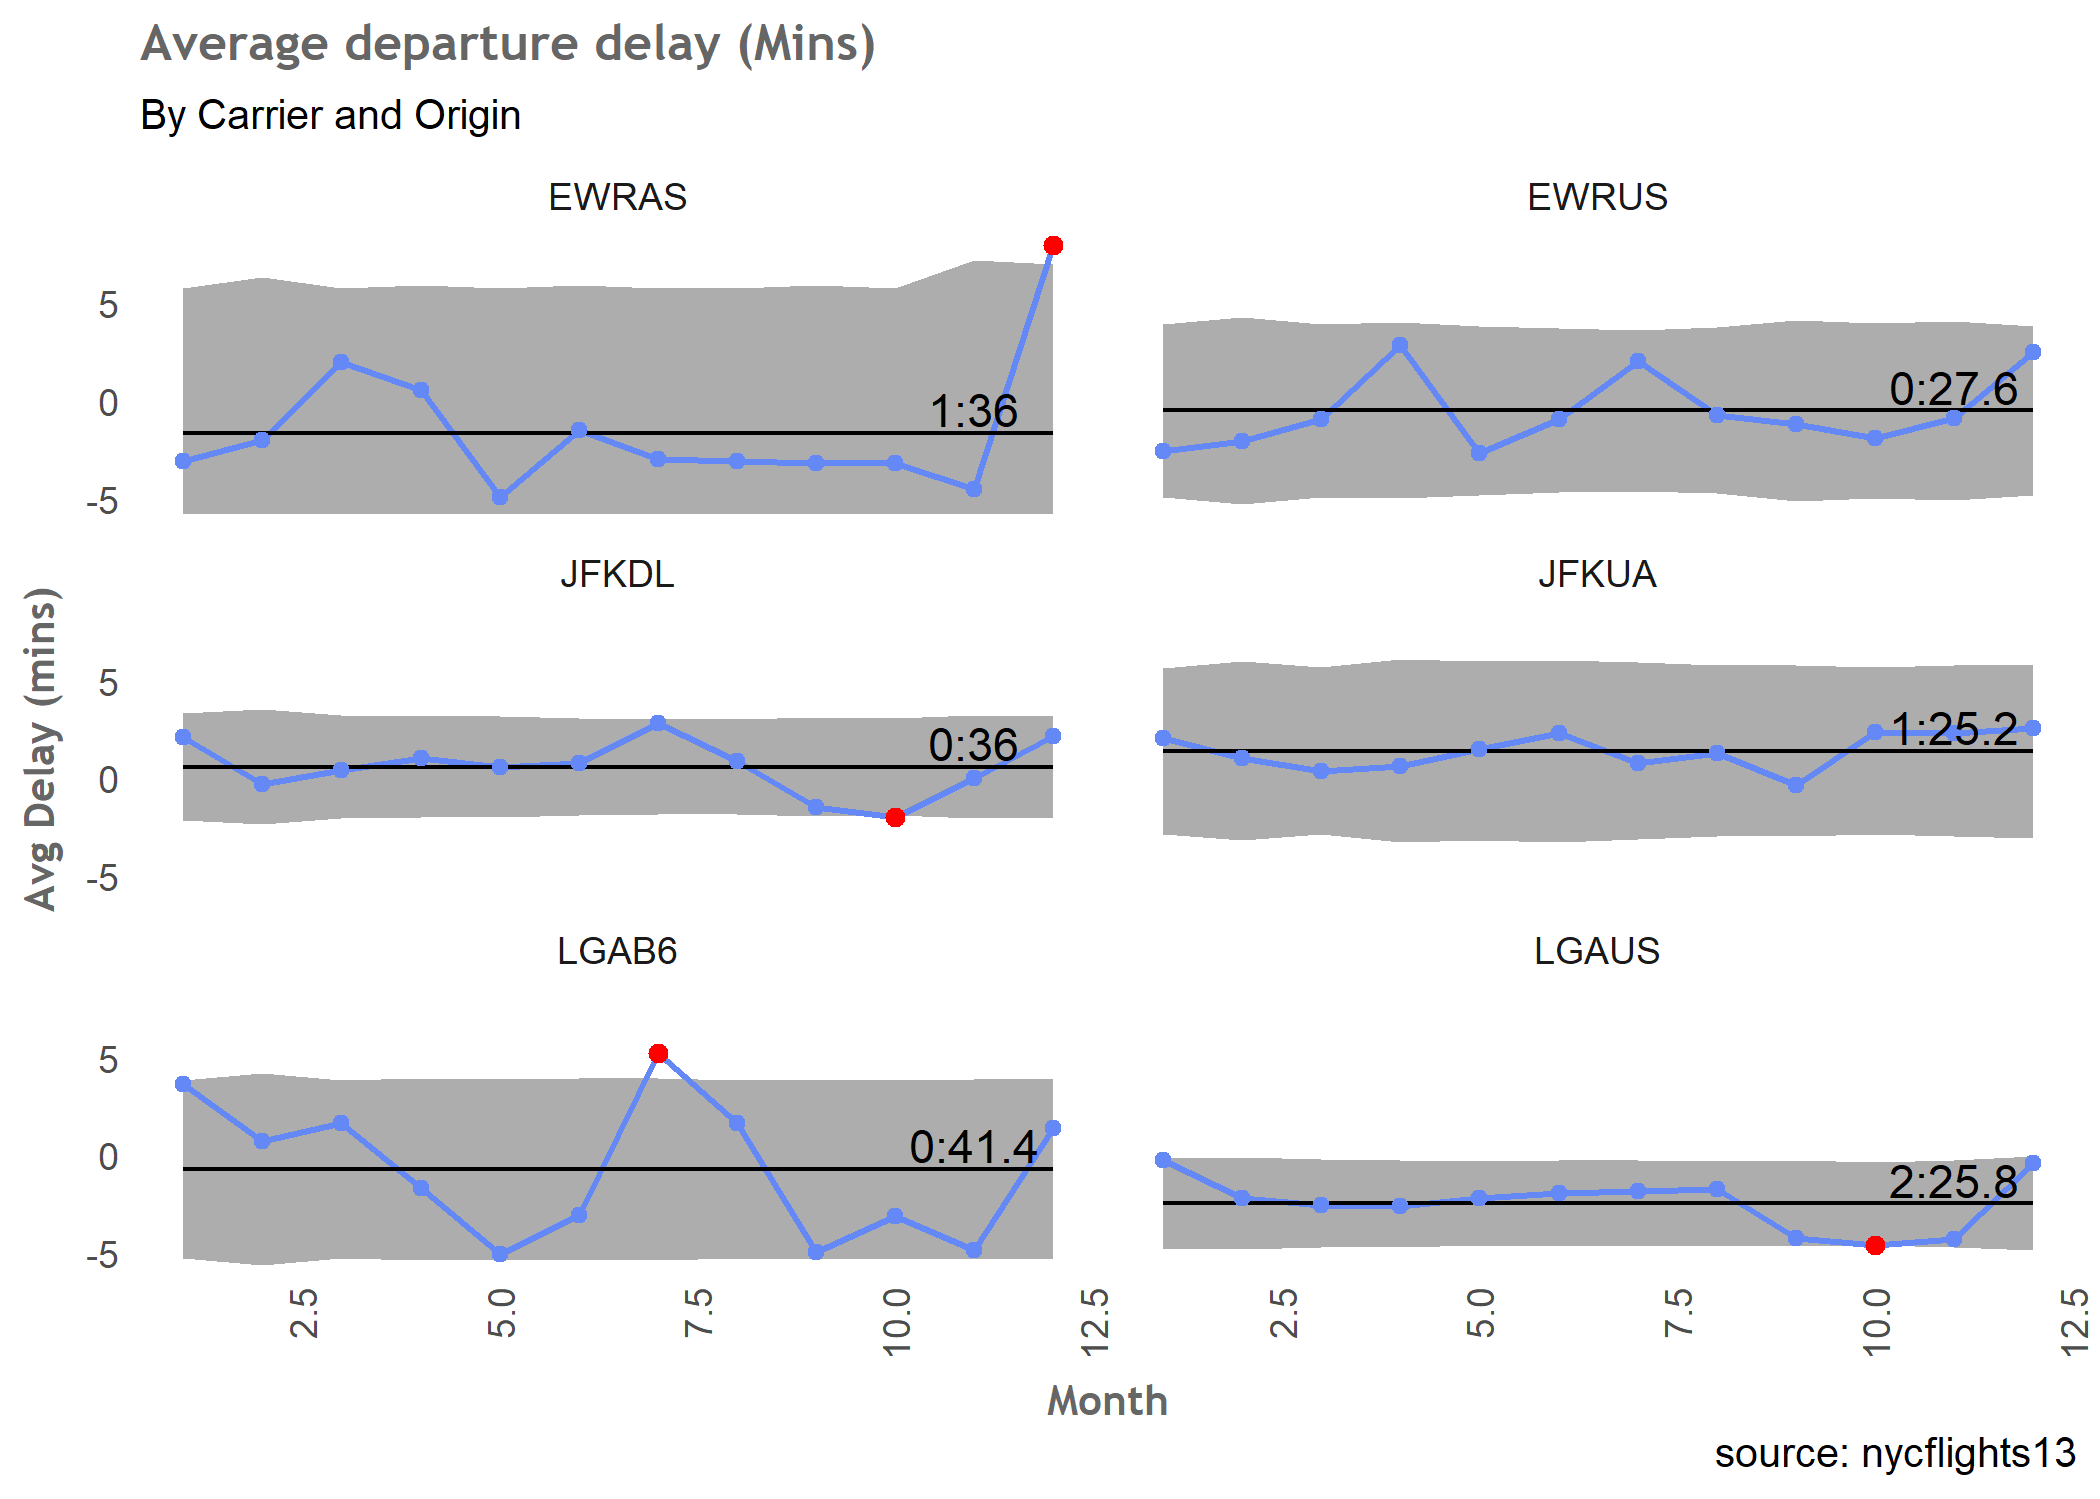
Backed by Data
Minimising the risk of delayed departure with process control charts Continue reading Backed by Data
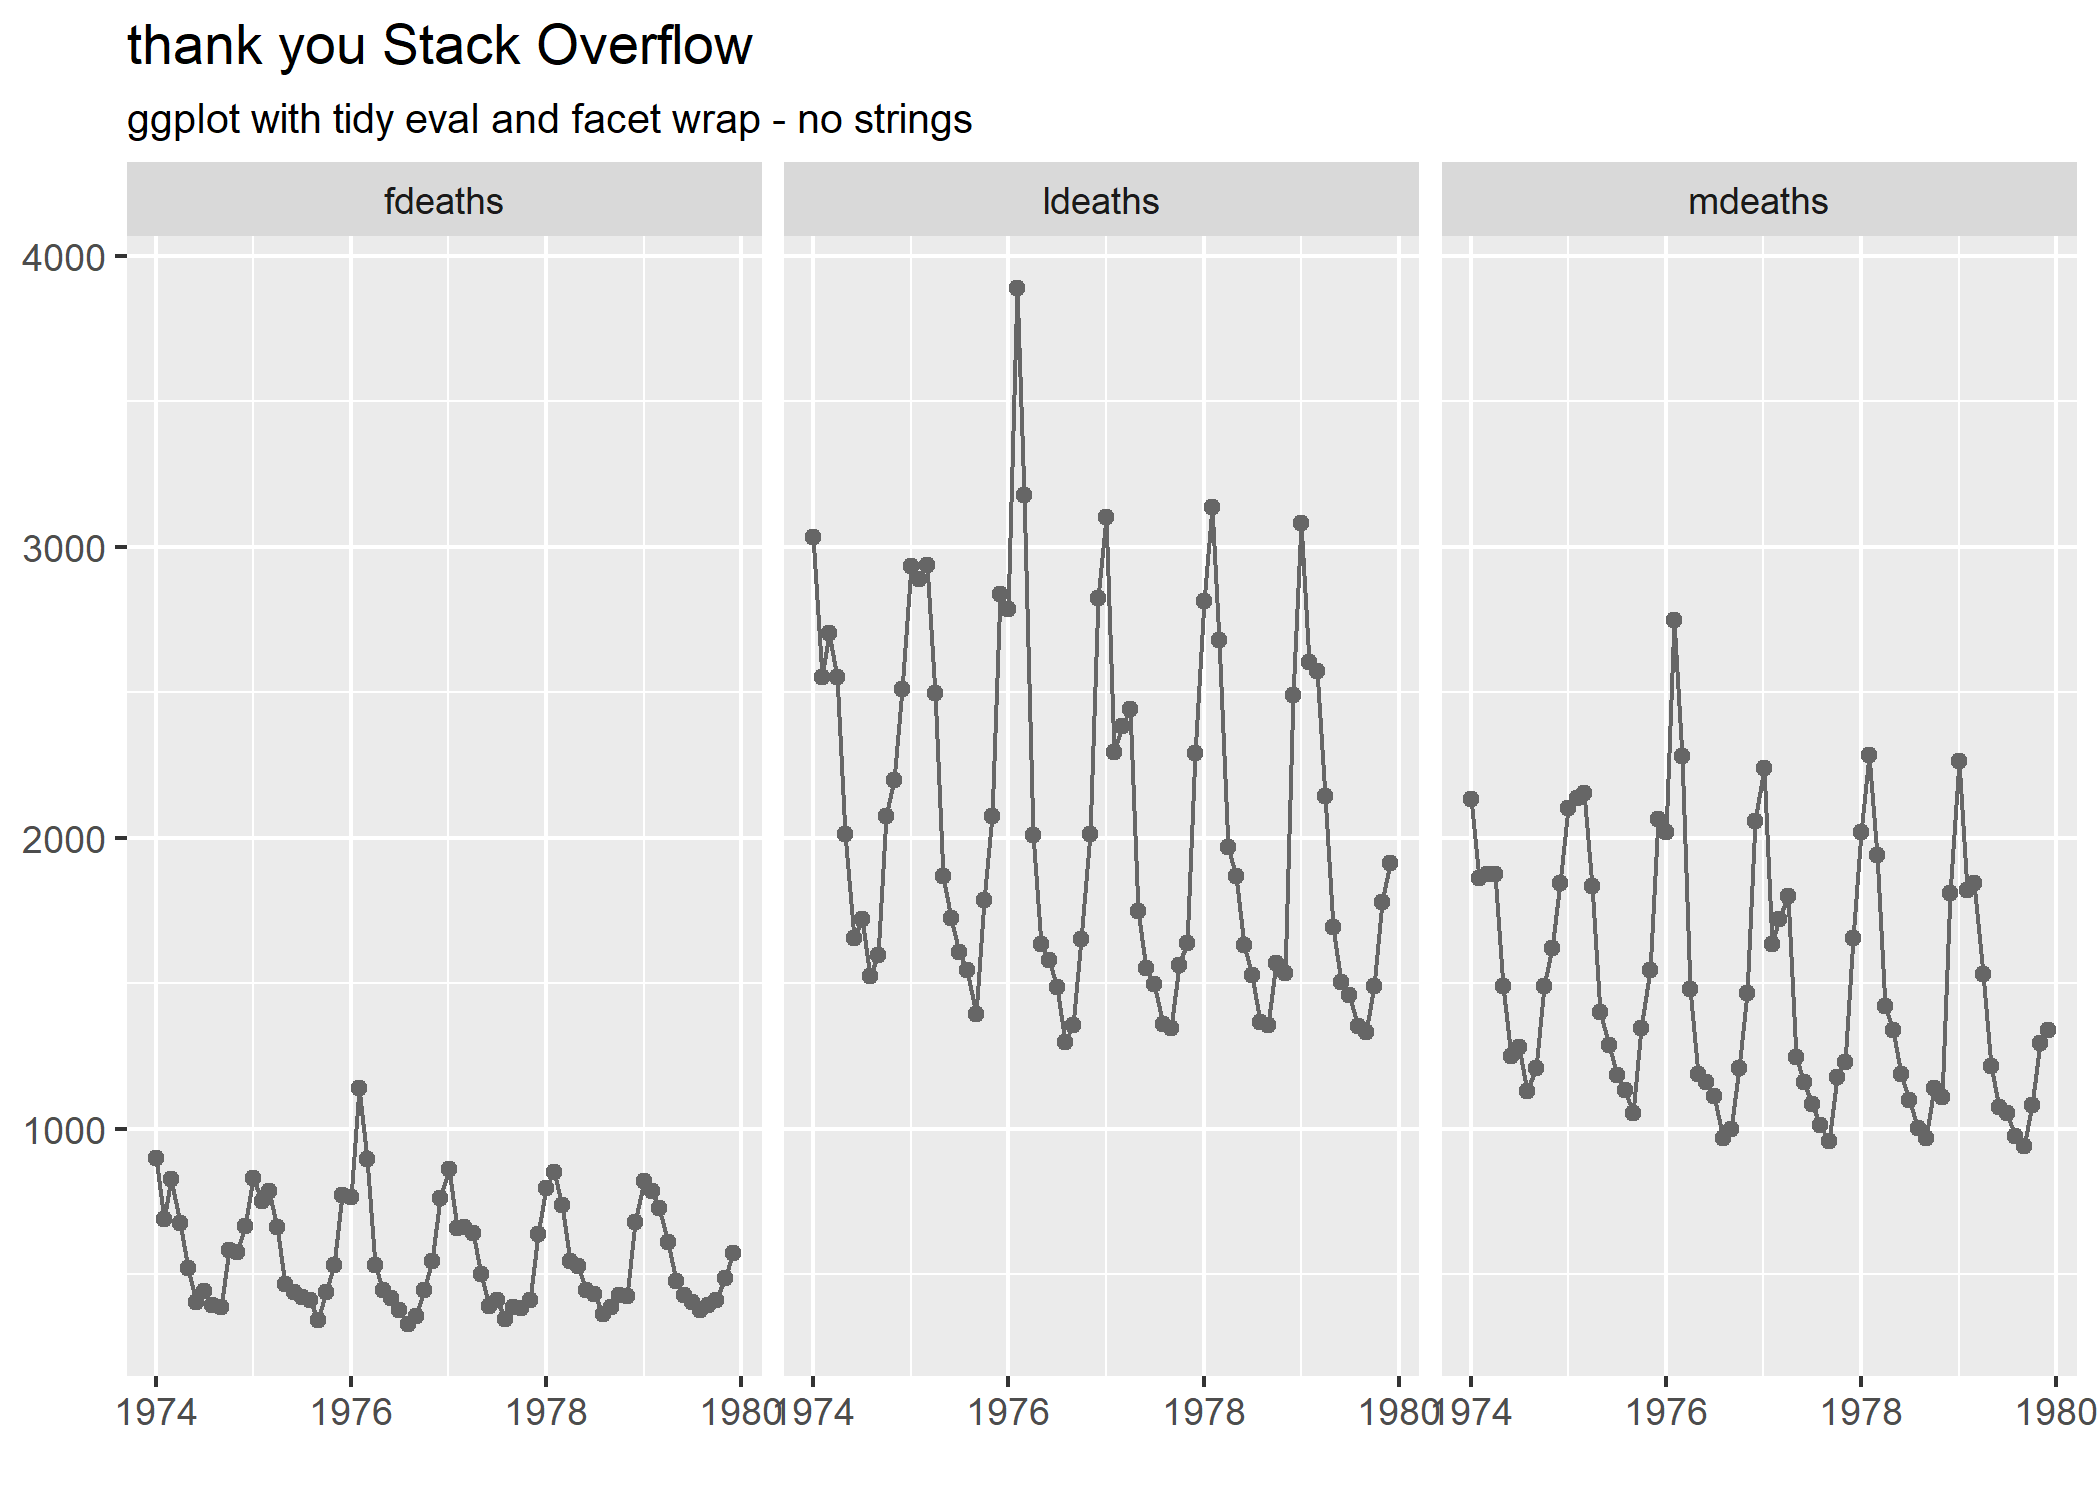
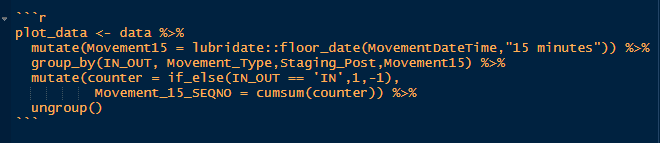
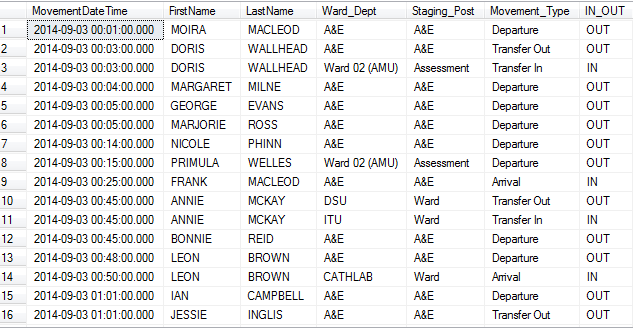
No strings attached
creating a faceting function with bare variable names in ggplot2, base R and rlang Continue reading No strings attached

Theory free tidyeval
Getting our feet wet with dplyr programming and non standard evaluation Continue reading Theory free tidyeval
Enter Sa(n)dMan
More Metallica sentiment analysis Continue reading Enter Sa(n)dMan
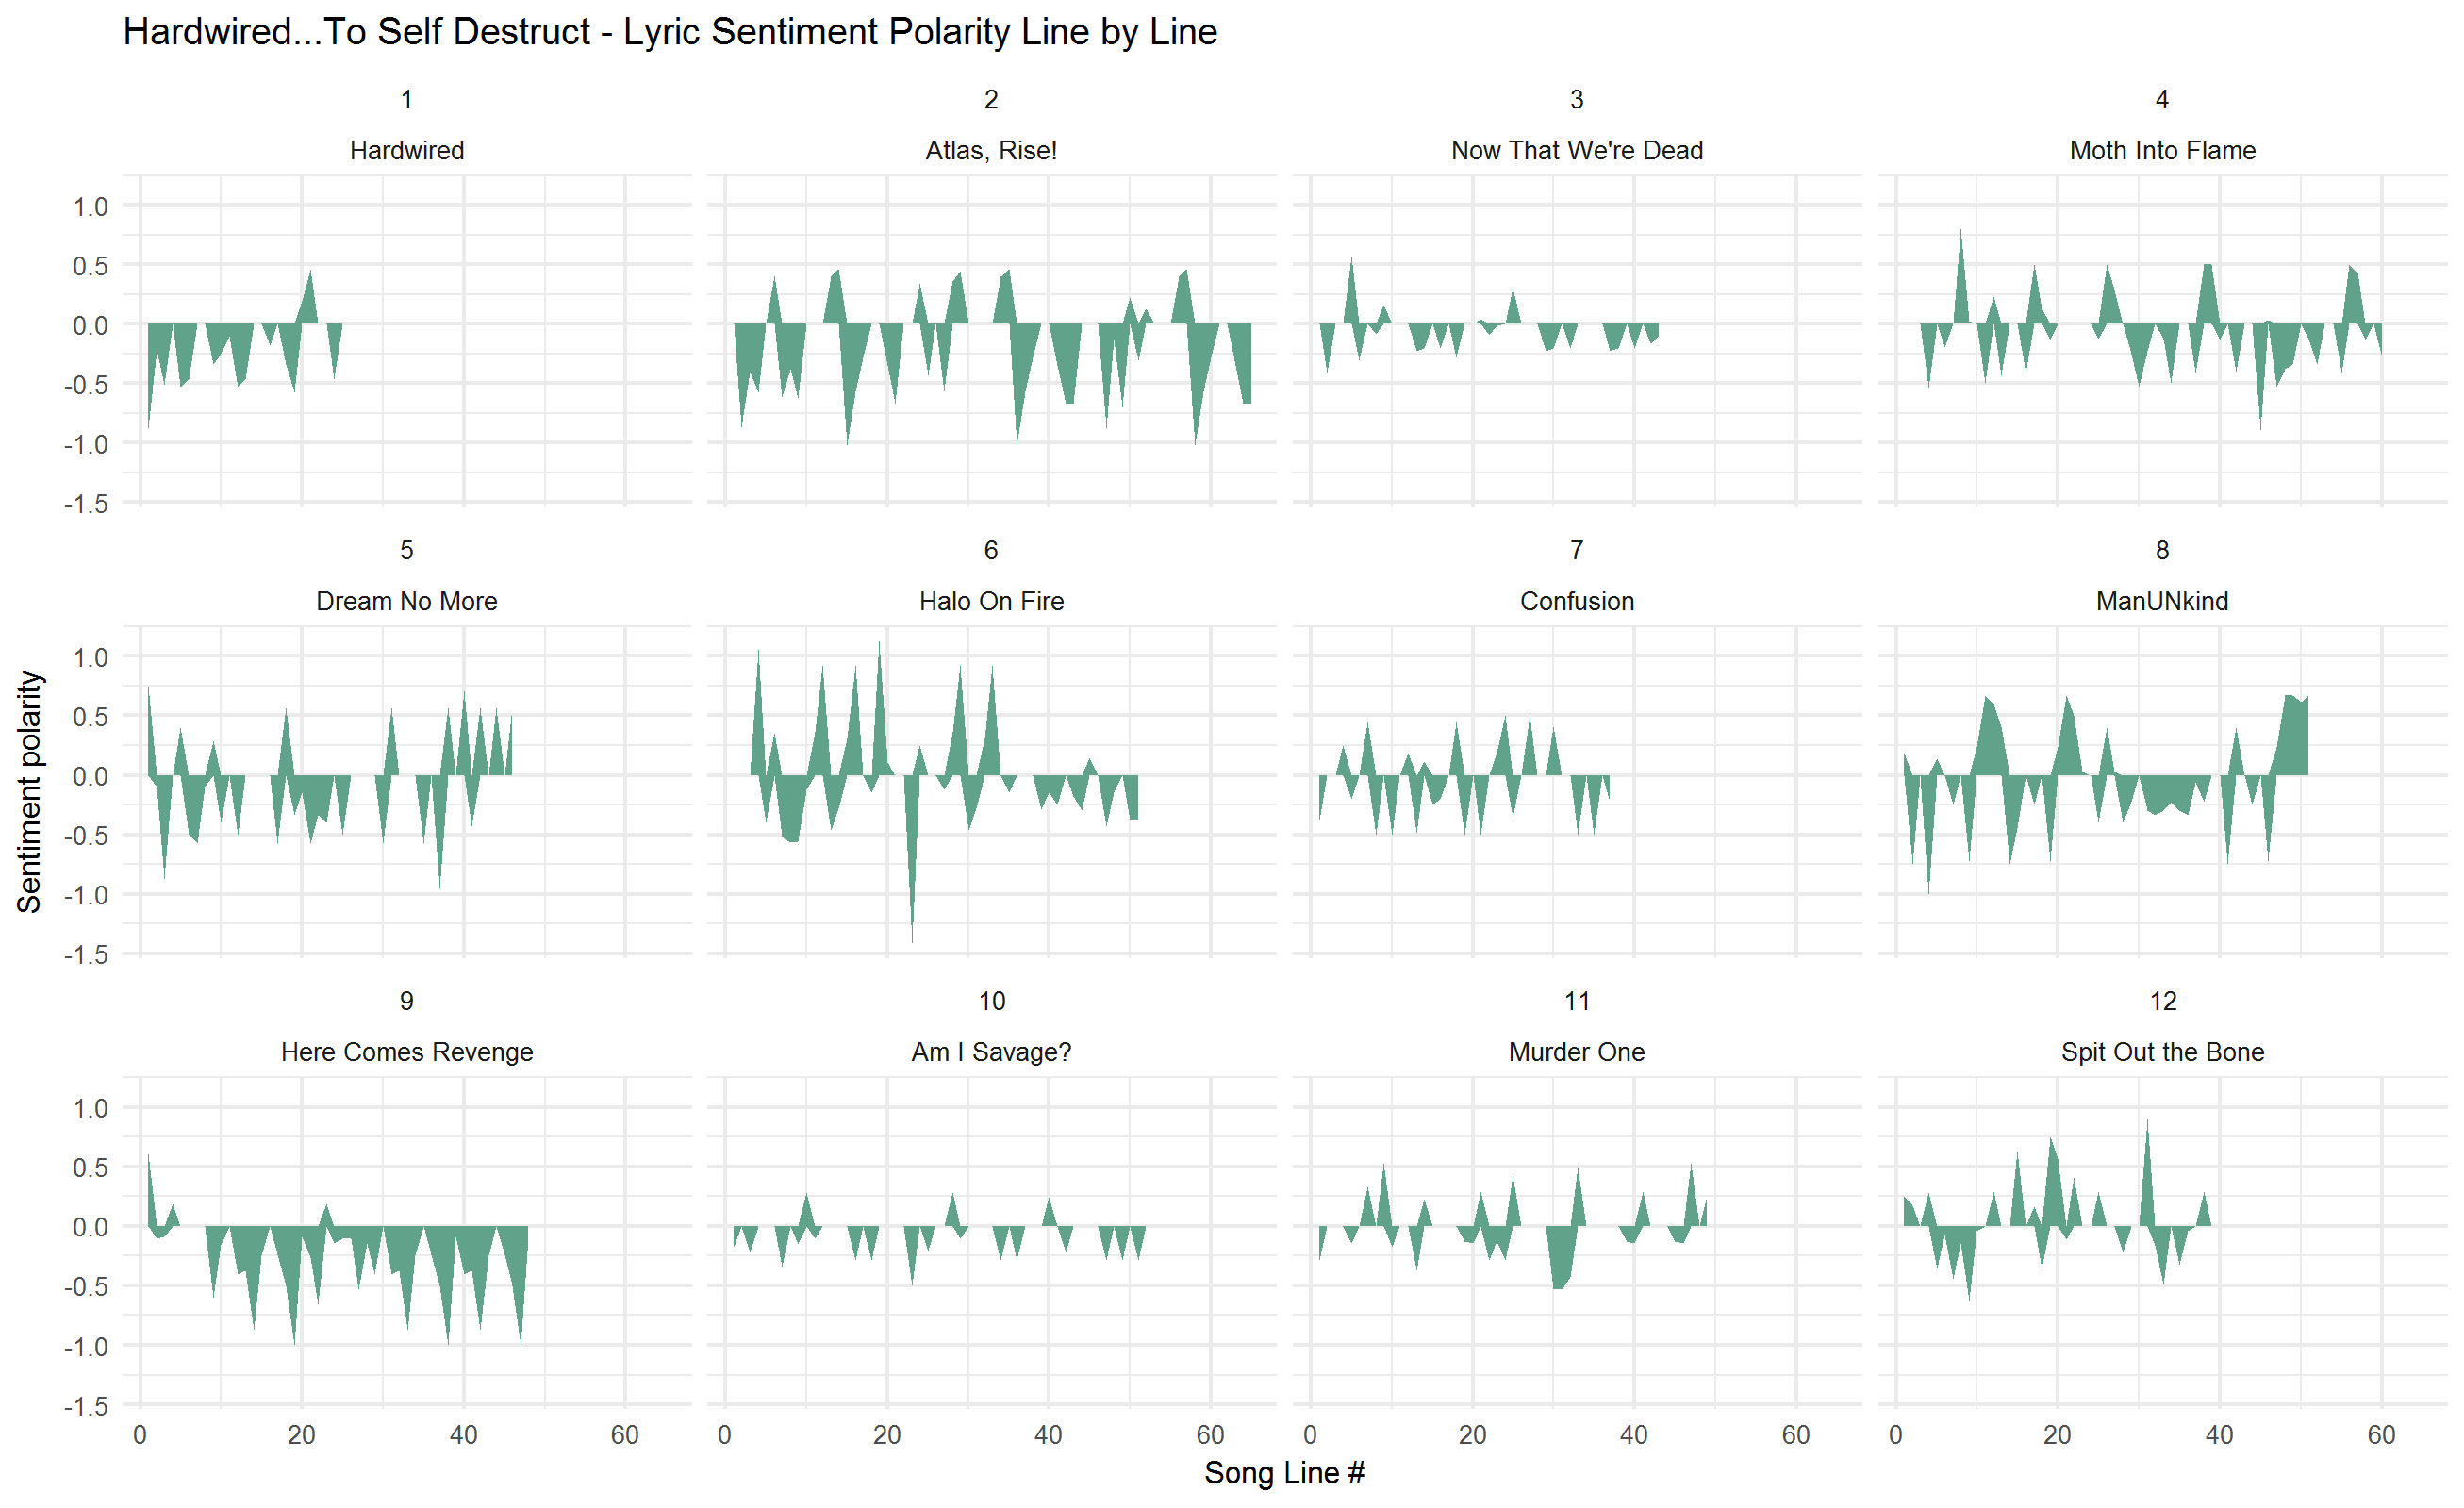
Hardwired..for tidy text
sentiment and text analysis of Metallica lyrics with genius and tidytext Continue reading Hardwired..for tidy text
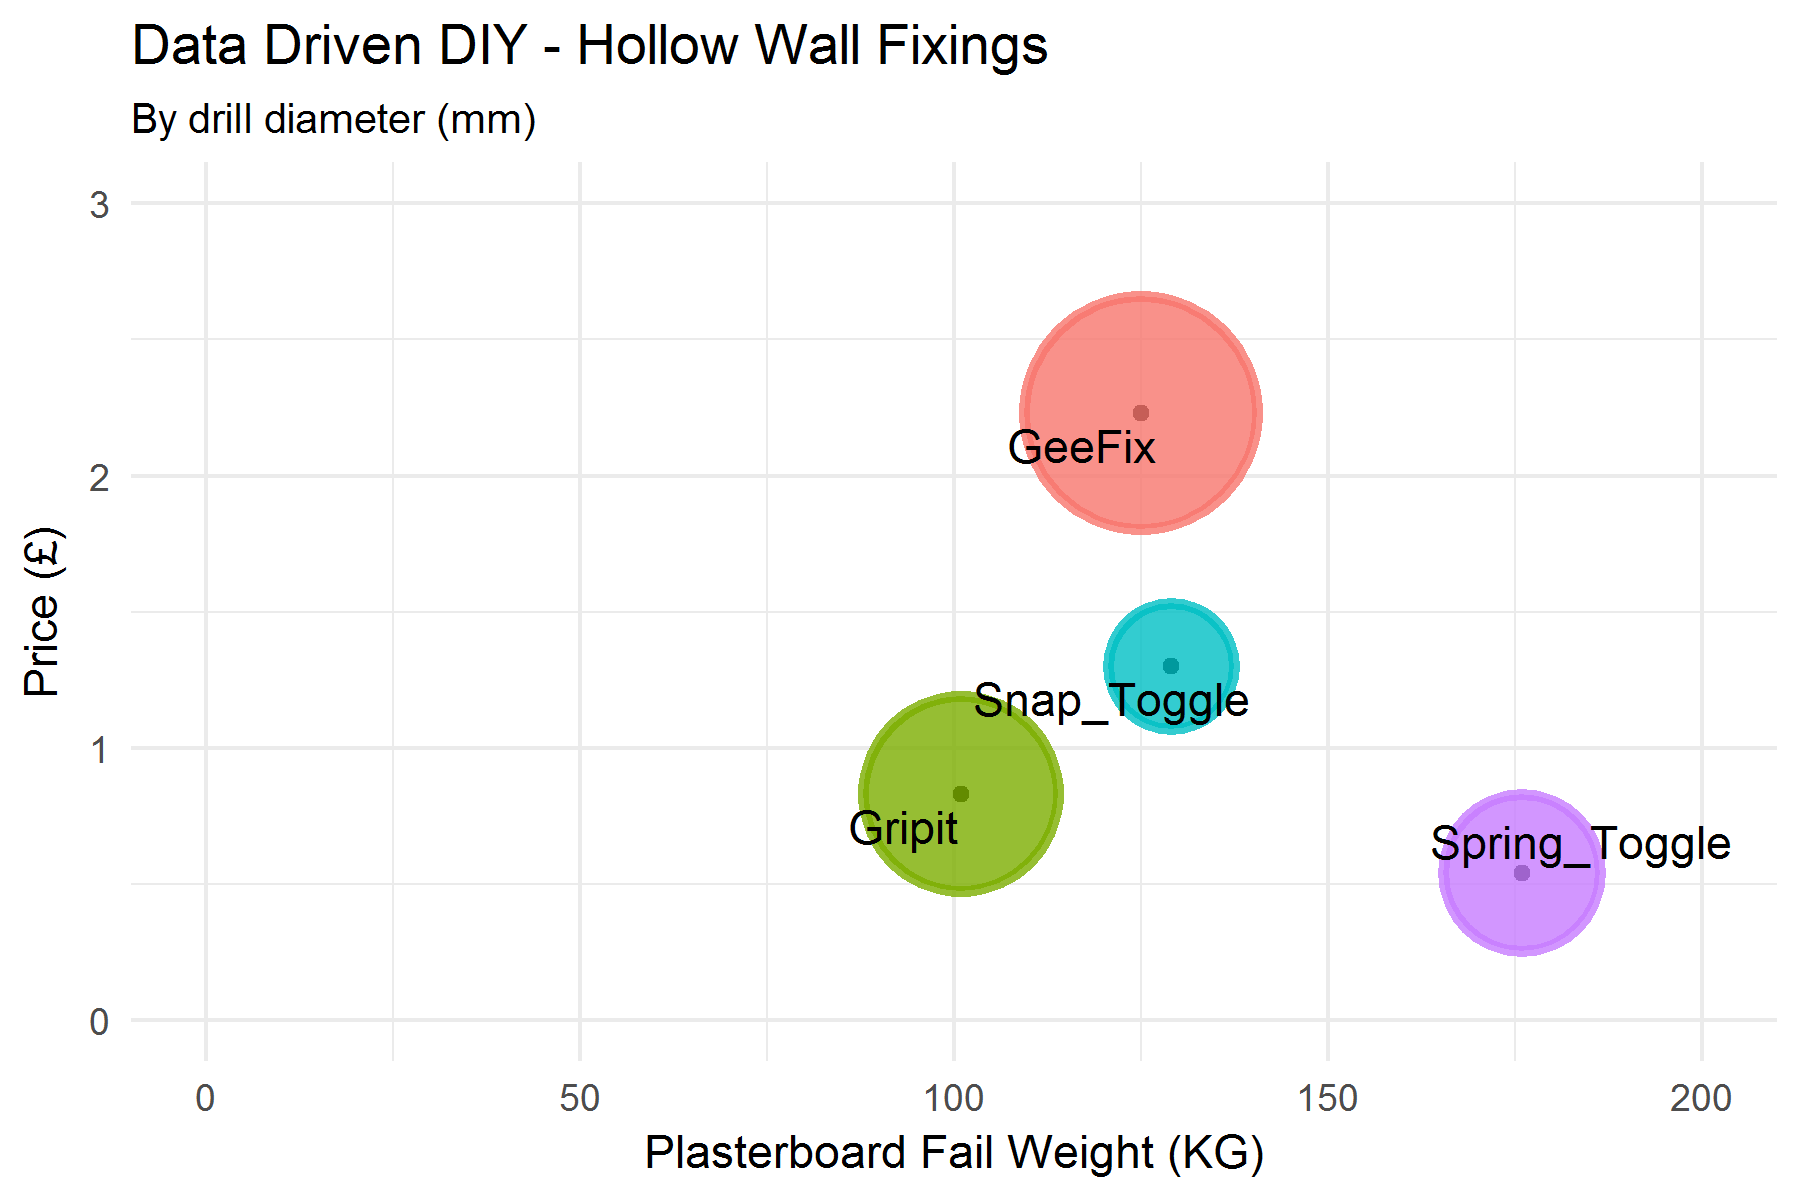
Data Driven DIY - Hardwired...to Shelf Construct
Yes, I’m blogging about drilling a hole in the wall. Send help.. Continue reading Data Driven DIY - Hardwired...to Shelf Construct
2017

Time To Shine
Blogging and social media for introverts - it CAN be done Continue reading Time To Shine
Let it flow, let it flow, let it flow......
Visualising patient flow with animated dotplots Continue reading Let it flow, let it flow, let it flow......

It's a dirty job, but someone's got to do it..
A tidytext analysis of Faith No More lyrics Continue reading It's a dirty job, but someone's got to do it..
Mapping to a 't'(map)
the tmap package for beautiful static and interactive maps with R Continue reading Mapping to a 't'(map)
Simply Mapping
Using the simple features package (sf) to map Scottish Index of Multiple Deprivation (SIMD) 2016 data Continue reading Simply Mapping
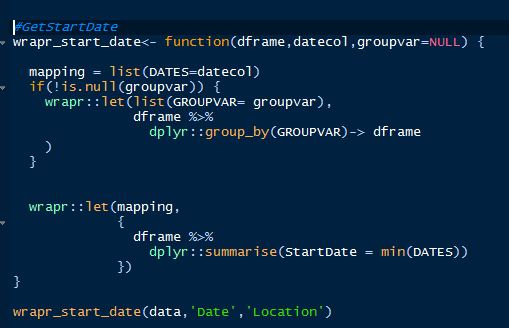
let there be progress
The ‘wrapr’ package for use with dplyr programming Continue reading let there be progress
The Run(chart)ing Man
Measurement for improvement in healthcare with R and Qlik Continue reading The Run(chart)ing Man

R to the Rescue
A strategy for gathering messy data scattered across several spreadsheets with R Continue reading R to the Rescue
2016
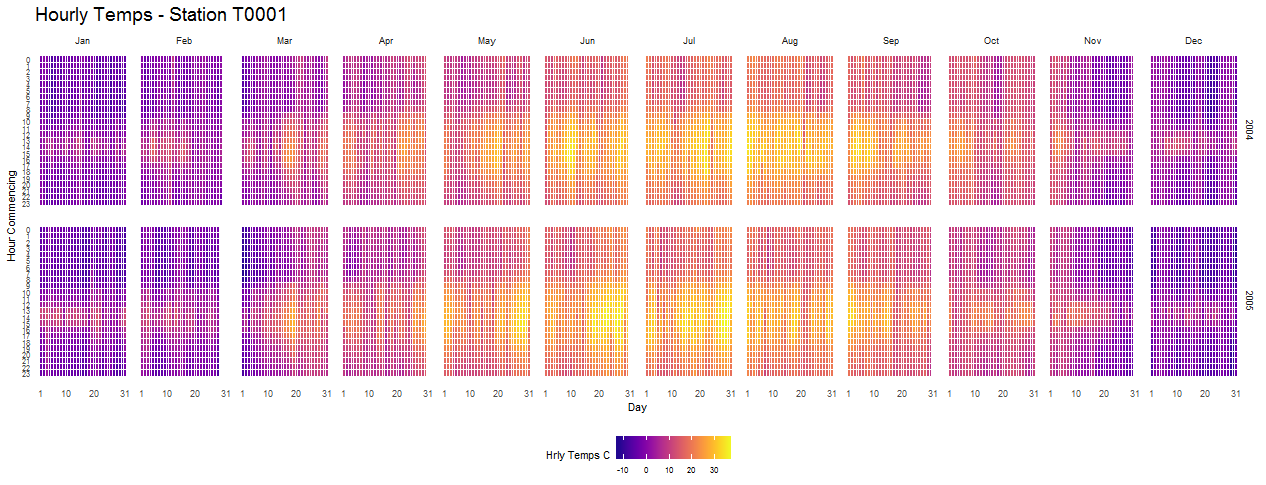
The hourly heatmap with ggplot2
A 24/7 timeseries heatmap with ggplot2, dplyr and lubridate Continue reading The hourly heatmap with ggplot2
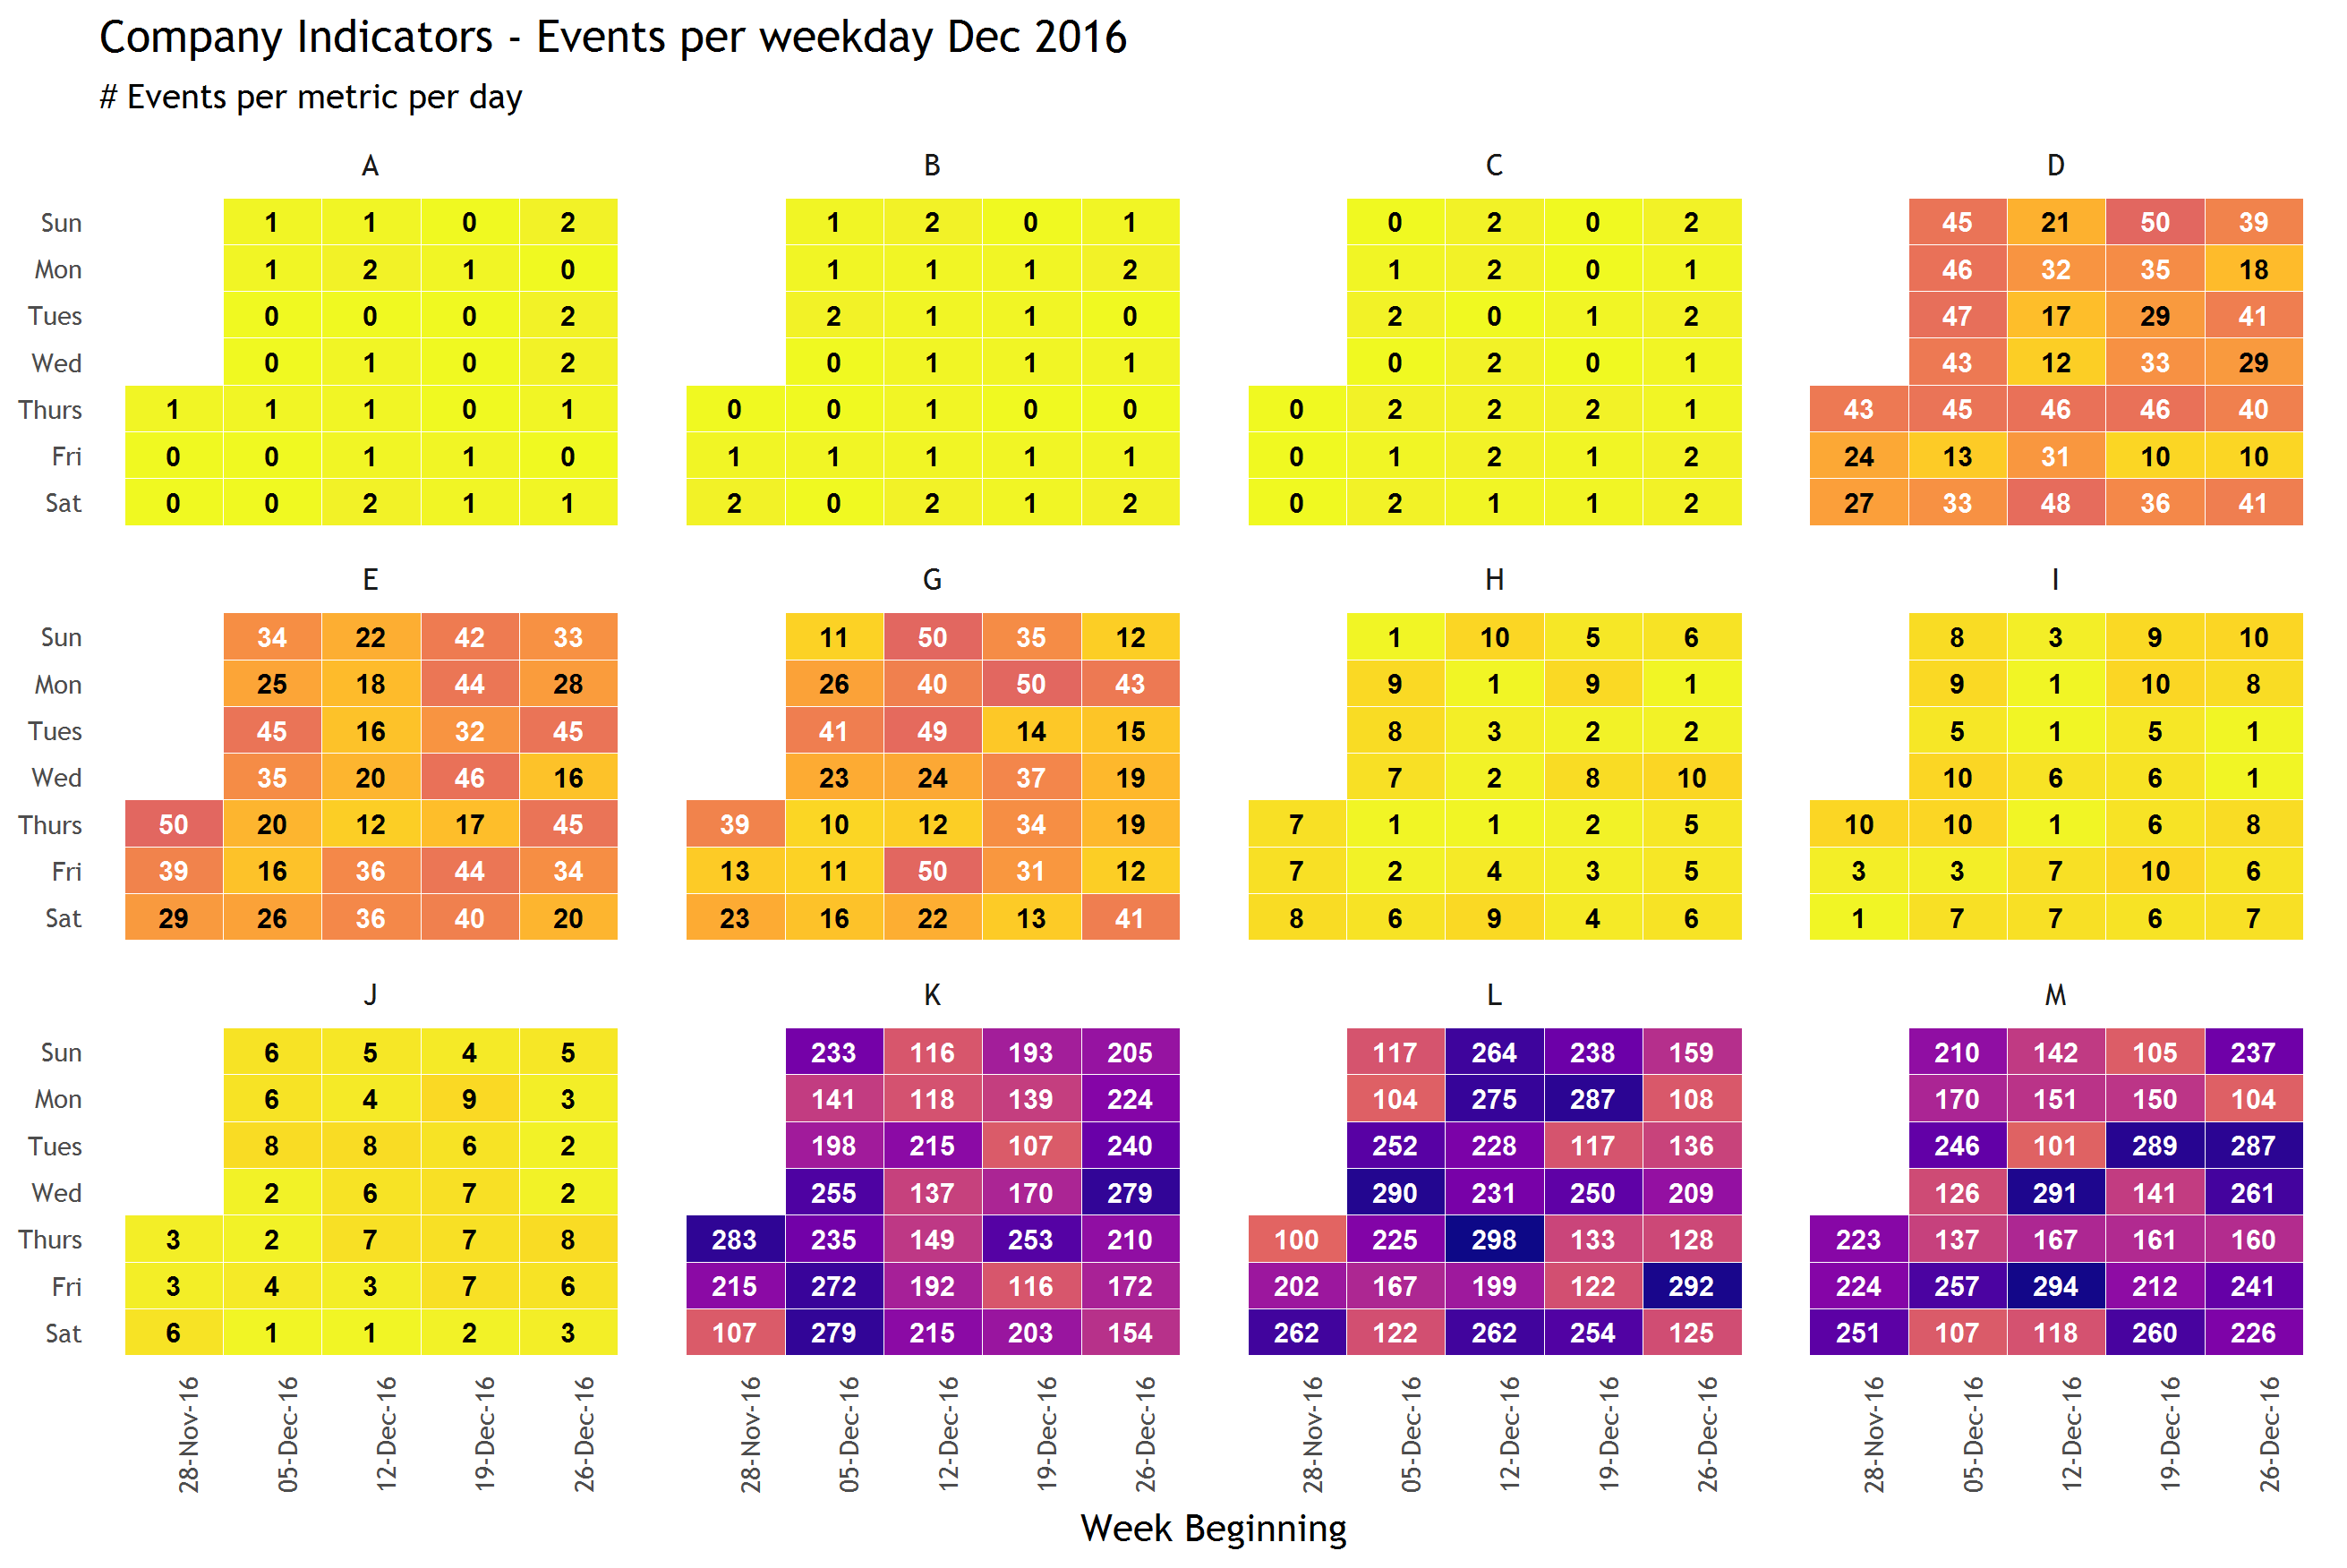
Daily metric tracking with ggplot2
Create calendar style plots over the same period with ggplot2 Continue reading Daily metric tracking with ggplot2
F is for Forecast
First steps with understanding time series, the forecast package and prediction using R Continue reading F is for Forecast
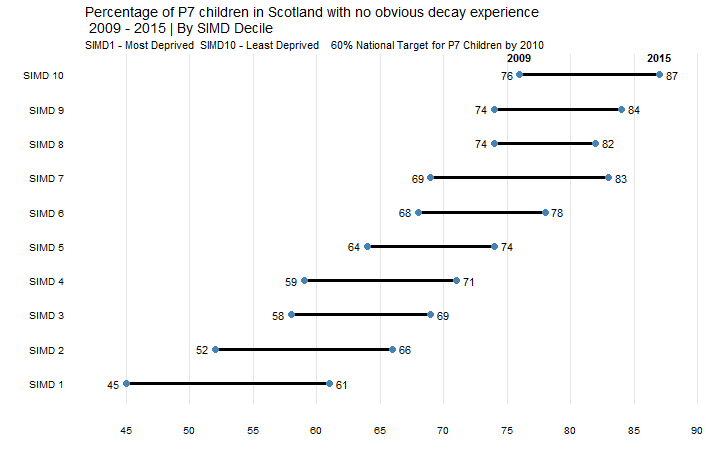
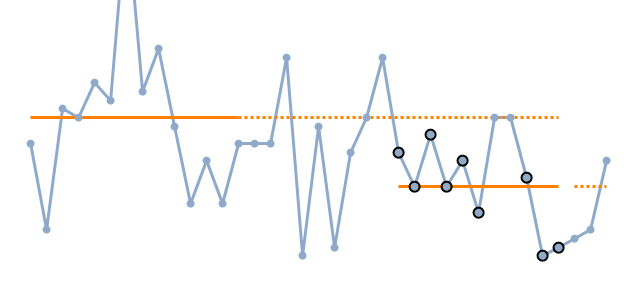
Chart MakeoveR
Working out and restyling a chart with (geom) dumbbells Continue reading Chart MakeoveR
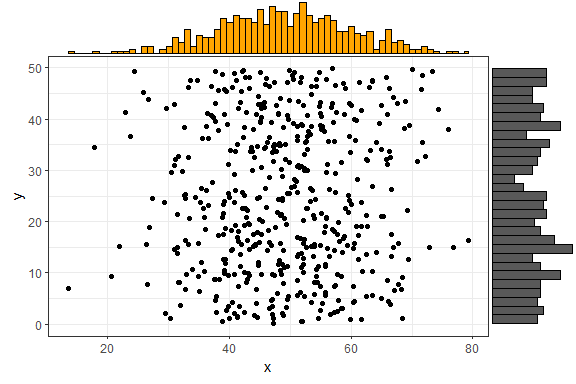
ggExtra is Extra useful
Amending scales on ggplots with easy to remember syntax Continue reading ggExtra is Extra useful