Tidily evaluated ggplot2 (Last updated: 2025-04-29)
Test driving tidy evaluation in the new release of ggplot2
A new release of ggplot2
Now that tidy evaluation is baked into ggplot2, as of TODAY, let’s take it for a spin:
ggplot2 3.0.0 %>%
create function %>%
test function %>%
end
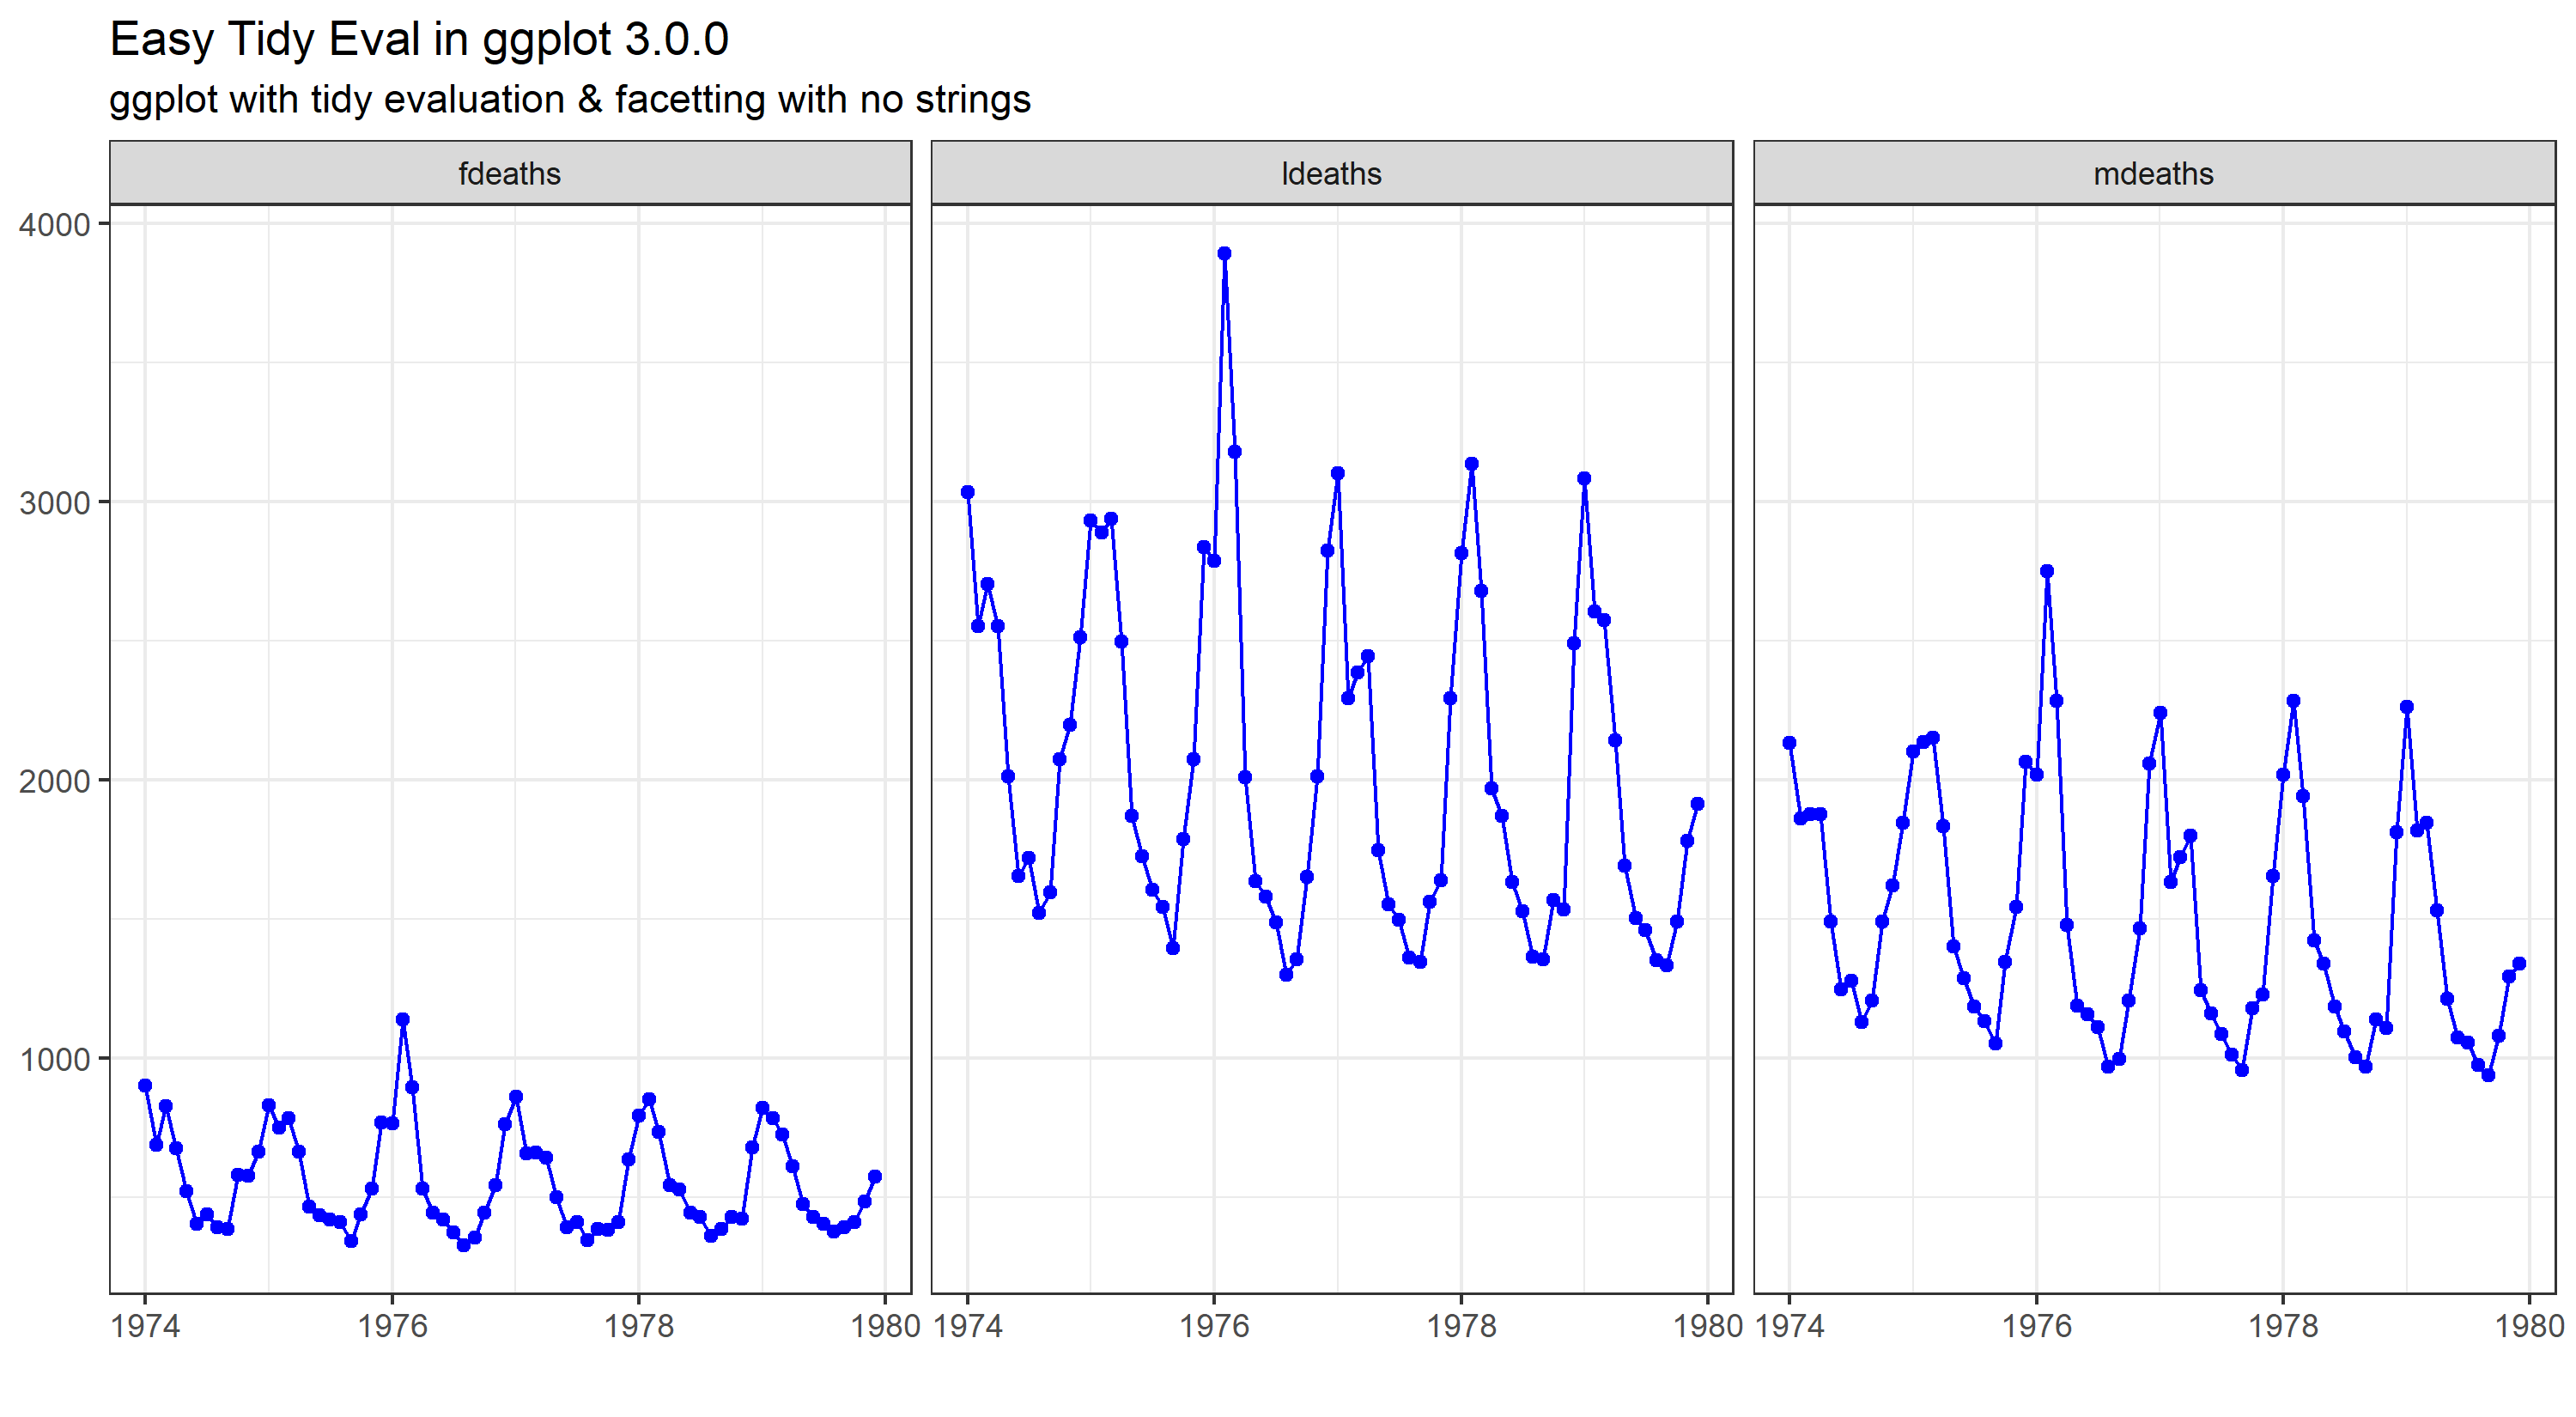
library(dplyr) library(ggplot2) library(tidyr) library(tibble) data <- list(fdeaths, mdeaths, ldeaths) #time series data - needs prep names(data)[1:3] <- c("fdeaths","mdeaths","ldeaths") data <- as_tibble(data) startdate <- as.Date('1974-1-1') data$date <- seq.Date(startdate,by = 'month',length.out = 72) newdata <- tidyr::gather(data, key = key, value = value,-date) newdata$value <- as.numeric(newdata$value) # create generic function gtest <- function(df,x,y, group) { x_quo <- enquo(x) y_quo <- enquo(y) group_quo <- enquo(group) p <- ggplot(df,aes(x = !!x_quo, y = !!y_quo)) + #bangin' geom_line(colour = "blue", group = 1) + geom_point(colour = "blue") + facet_wrap(group_quo, ncol = 3) #look Ma, no need to bang bang here! p <- p + ggtitle(label = "Easy Tidy Eval in ggplot 3.0.0", subtitle = "ggplot with tidy evaluation & facetting with no strings") p <- p + labs(x = NULL, y = NULL, caption = "") + theme_bw() print(p) } Let’s test it:
gtest(newdata,date,value,key)
End
Hey there! Just wanted to let you know that we’ve updated the content with the latest info, and we've even added some extra bits specifically for our friends in the Japanese region. If you're curious, feel free to click on the link below to dive into the full article!
https://www.johnmackintosh.net/jp/article/26/ggplot2-tidy-data-visualization-adventure。