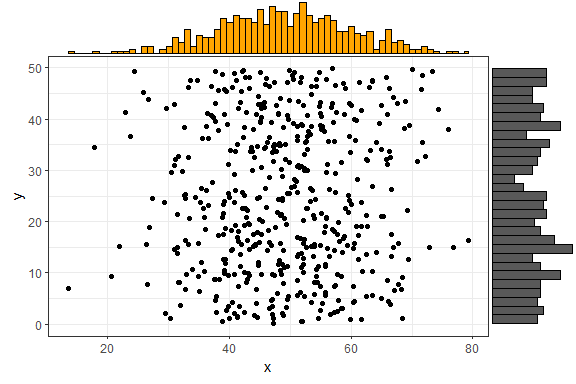
ggExtra is Extra useful (Last updated: 2025-04-15)

Amending scales on ggplots with easy to remember syntax
I love ggplot2, but I struggle to remember some of the specific syntax I need to get my plots looking the way I want, especially those relating to making tweaks in the theme settings.
Two of my most common changes are to rotate x axis labels, (so every date point is labeled), and removing the default grid lines.
The main reason I remove these is because I’m most often producing run or control charts, which need no additional distracting lines.
Typically to rotate the x-axis I need to add the following line to my code:
theme(axis.text.x = elementtext(angle=90, vjust=0.5)) And to remove (all) gridlines:
theme(panel.grid.minor=elementblank(), panel.grid.major=elementblank()) Sometimes I only want to remove the minor lines:
theme(panel.grid.minor=elementblank()) The ggExtra package makes both simple with the rotateTextX and removeGrid functions. Rotating the x axis labels now requires just:
rotateTextX() and removing gridlines:
removeGrid() By default removeGrid() removes all gridlines, (minor gridlines are always removed), and you can specify a particular axis if you wish .e.g.
removeGridX() #or removeGridY() This is much easier to remember, and makes it easier to label all the dates on the x-axis.
You may also like to check out the cowplot package, which produces grid-free plots by default, and makes it easier to display multiple plots side by side.