deprivation
Posts about deprivation and SIMD.
SIMD Revisited
Visualising the 2020 Scottish Index of Multiple Deprivation data using beewswarm plots, scatter plots and alternative ggplot2 themes and palettes. Continue reading SIMD Revisited
Mapping to a 't'(map)
the tmap package <- beautiful static and interactive maps with R Continue reading Mapping to a 't'(map)
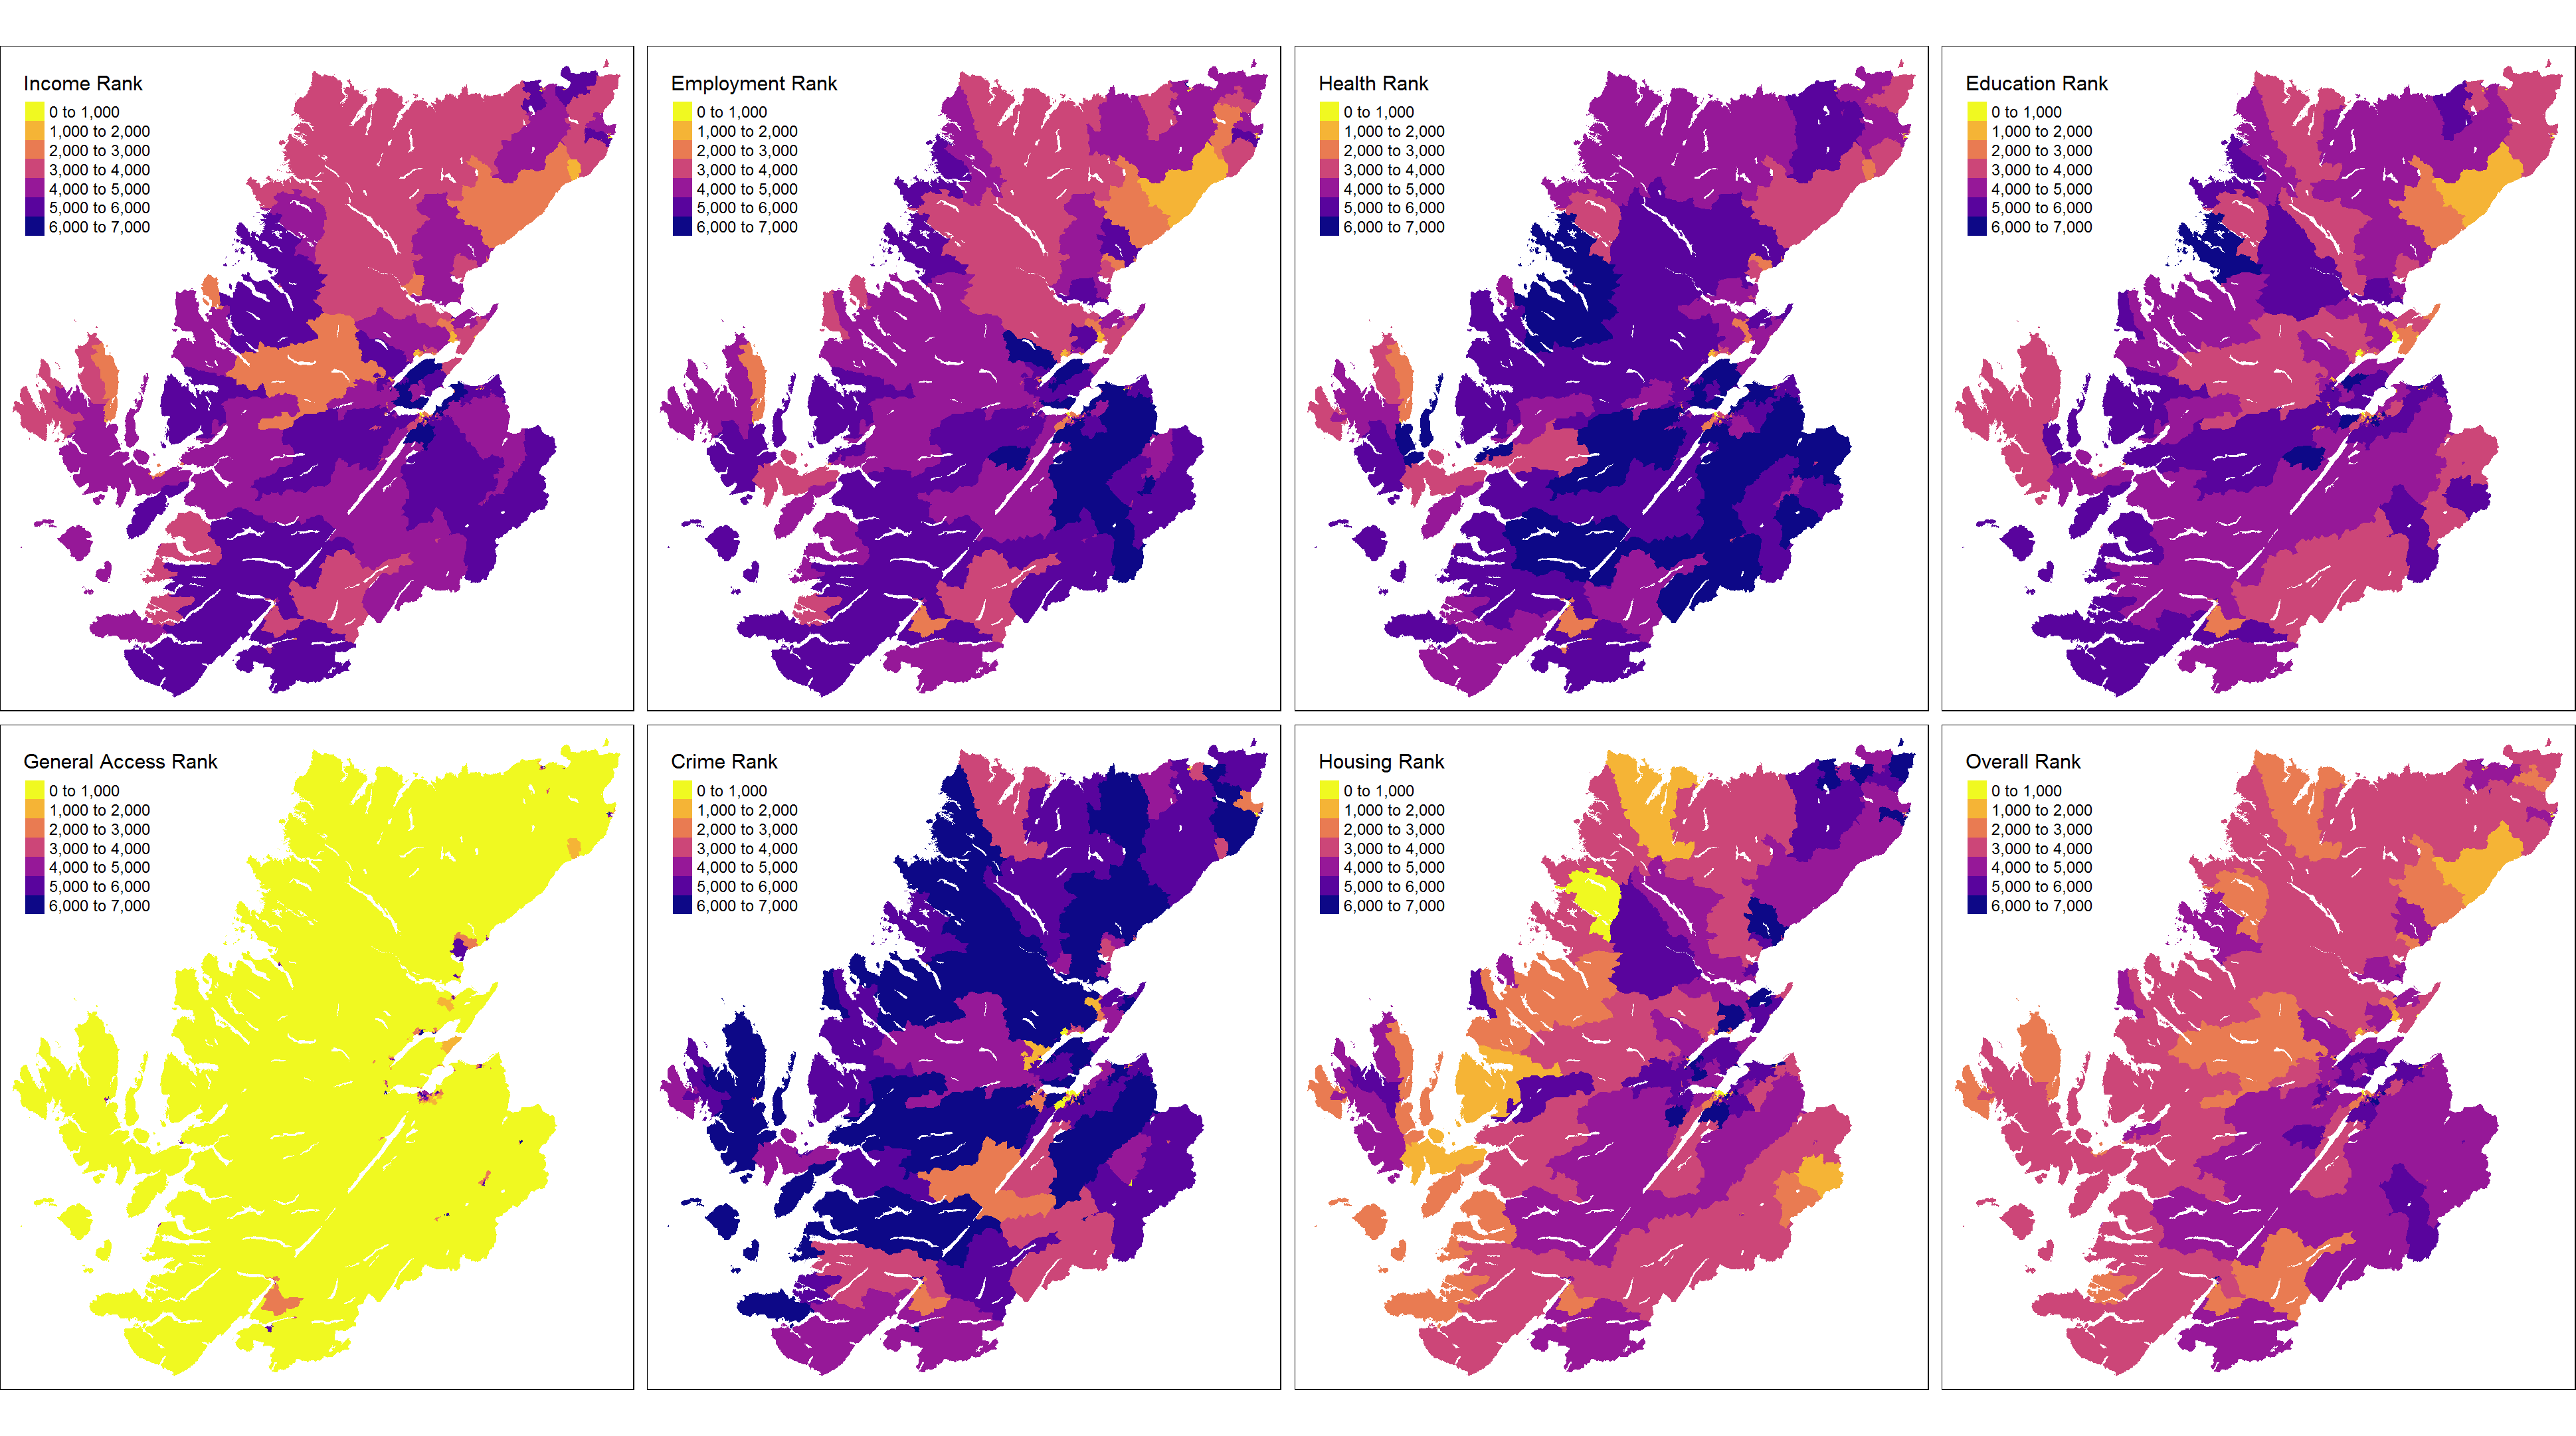
Simply Mapping
Using the simple features package (sf), dplyr and ggplot2 to map Scottish Index of Multiple Deprivation (SIMD) 2016 data Continue reading Simply Mapping
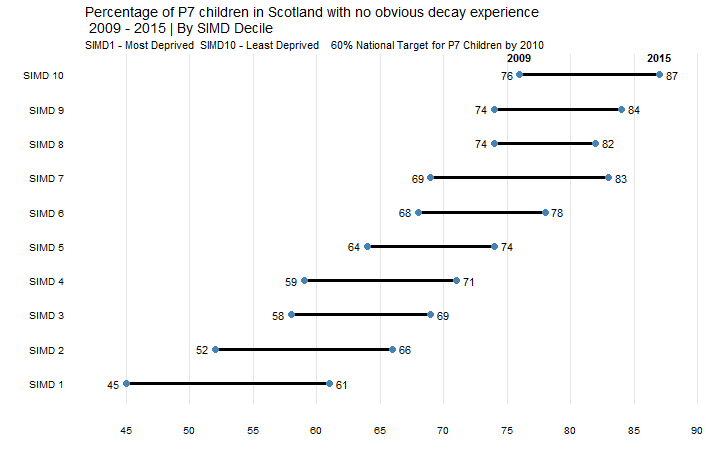
Chart MakeoveR
Working out and restyling a chart with (geom) dumbbells Continue reading Chart MakeoveR