spccharter
Projects | Links: spccharter
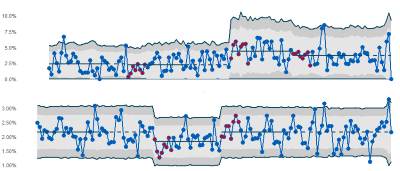
Automatic plotting, analysis and revising of control limits at scale.
In development, think of this package as ‘runcharter, but for spc charts’.
It will plot multiple charts, look for long run signals of change, and revise control limits over a specified number of points, from the start of the run.
Based on feedback from runcharter, this package accepts bare variable names, and you can supply one unquoted or two quoted grouping variables to increase it’s versatility.
There are multiple parameters that can be configured to ensure your final plot looks just the way you want it.